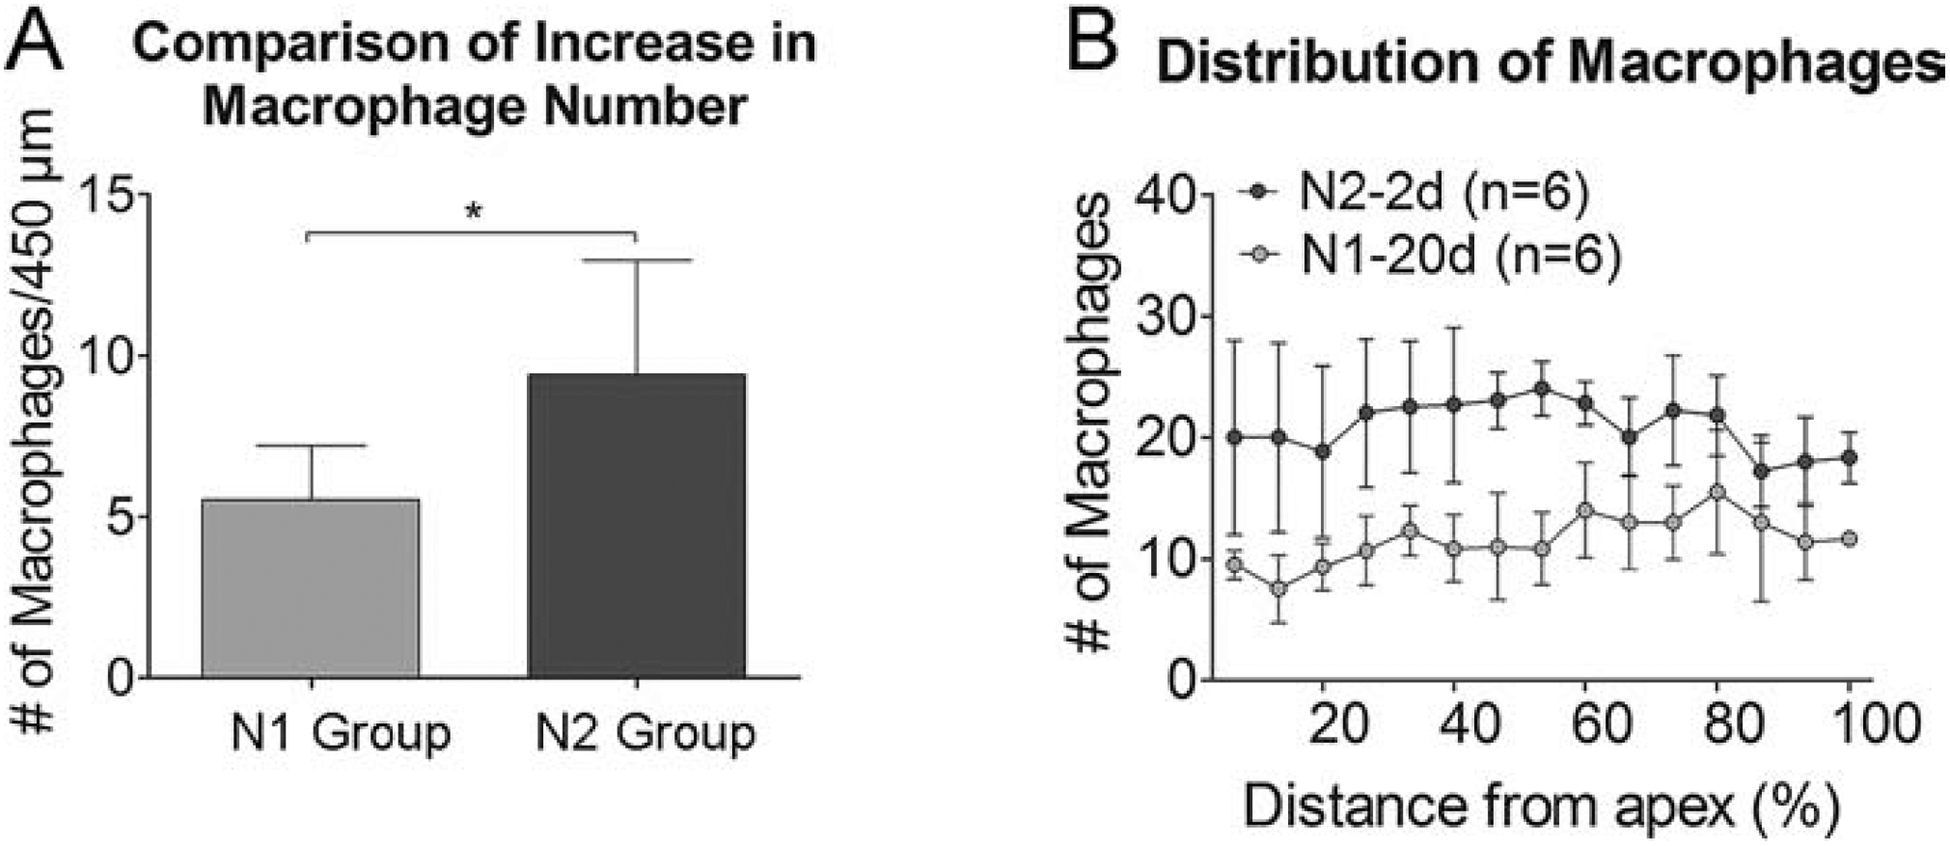
Figure 11. Expansion of the macrophage population in the acute phase of acoustic injury.

A. Comparison of the increase in the number of basilar membrane macrophages between the N1 and the N2 group examined at 2 days after noise exposure. The magnitude of the increase is significantly higher following the second noise exposure as compared with that observed afterthe initial noise exposure (5.5 ± 1.7 cells per 450 μm vs. 9.4 ± 3.5 cells per 450 μm for the first and the second group, respectively; * indicates P < 0.05). B. Macrophage-gram illustrating the distribution of macrophages along the cochlear spiral before (N1–20d) and 2 days (N2–2d) after exposure to the second noise. The increase of macrophages is present relatively homogeneously across 0–80% distance from the apex. The level of the increase appears slightly smaller in the basal end of the cochlea (marked by the gray area). n = 6 cochleae biological replicates for each group.
