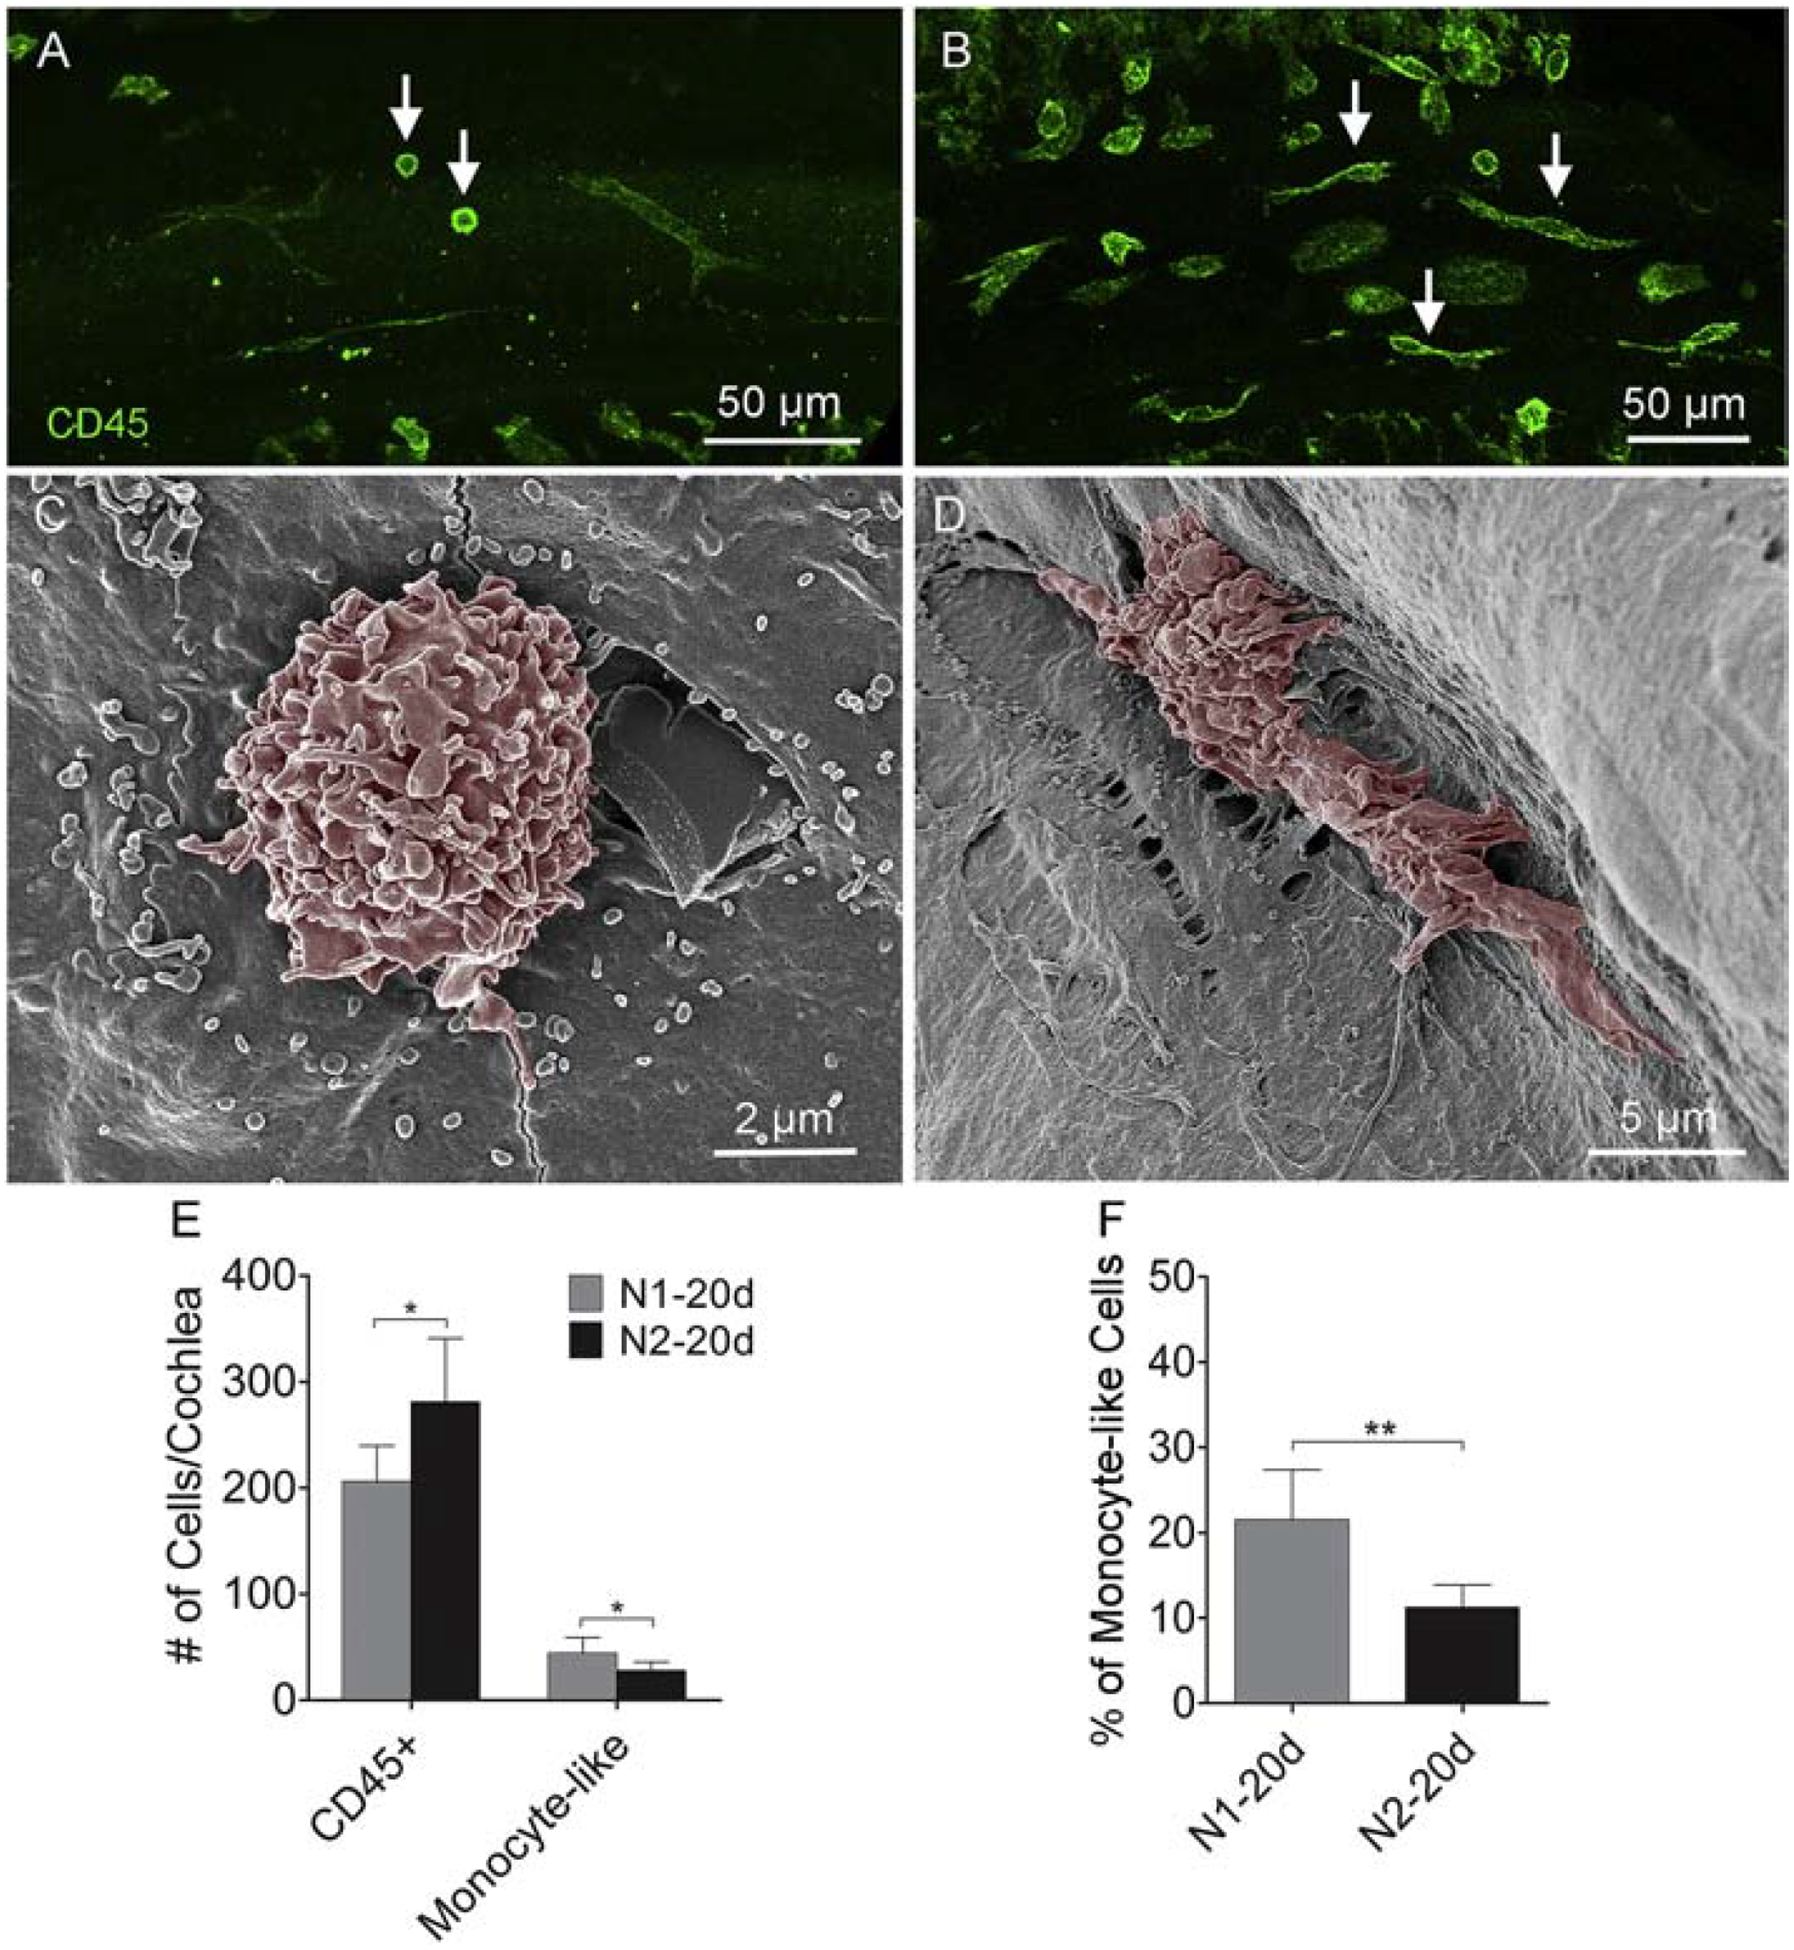
Figure 12. Comparison of the maturation levels of monocyte-like macrophages between the N1 and the N2 group.

A. Two days after the initial noise exposure, small, round CD45-positive cells are identified on the basilar membrane (arrows). B. Two days after the second noise exposure, small, CD45-positive cells display short, fine processes (arrows), suggesting that these cells are actively transforming into mature macrophages. C-D. Scanning electron micrographs showing the difference in the morphology of typical monocyte-like cells in cochleae from the N1–2d and N2–2d group. E. Comparison of the number of small, round monocyte-like cells and CD45-positive cells on the surface of the basilar membrane between the N1–20d and N2–20d groups. On average, there are more CD45-positive cells, but less monocyte-like cells, after the second noise exposure than those observed after the first noise exposure (* indicates P < 0.05). F. Comparison of the percentage of monocyte-like cells over the total number of basilar membrane macrophages per cochlea between the N1–2d and N2–2d group. Monocyte-like cells constitute approximately 21% of the total number of macrophages in the N1–2d group and 12% in the N2–2d group (** indicates P < 0.01). n = 6 cochleae biological replicates for each group.
