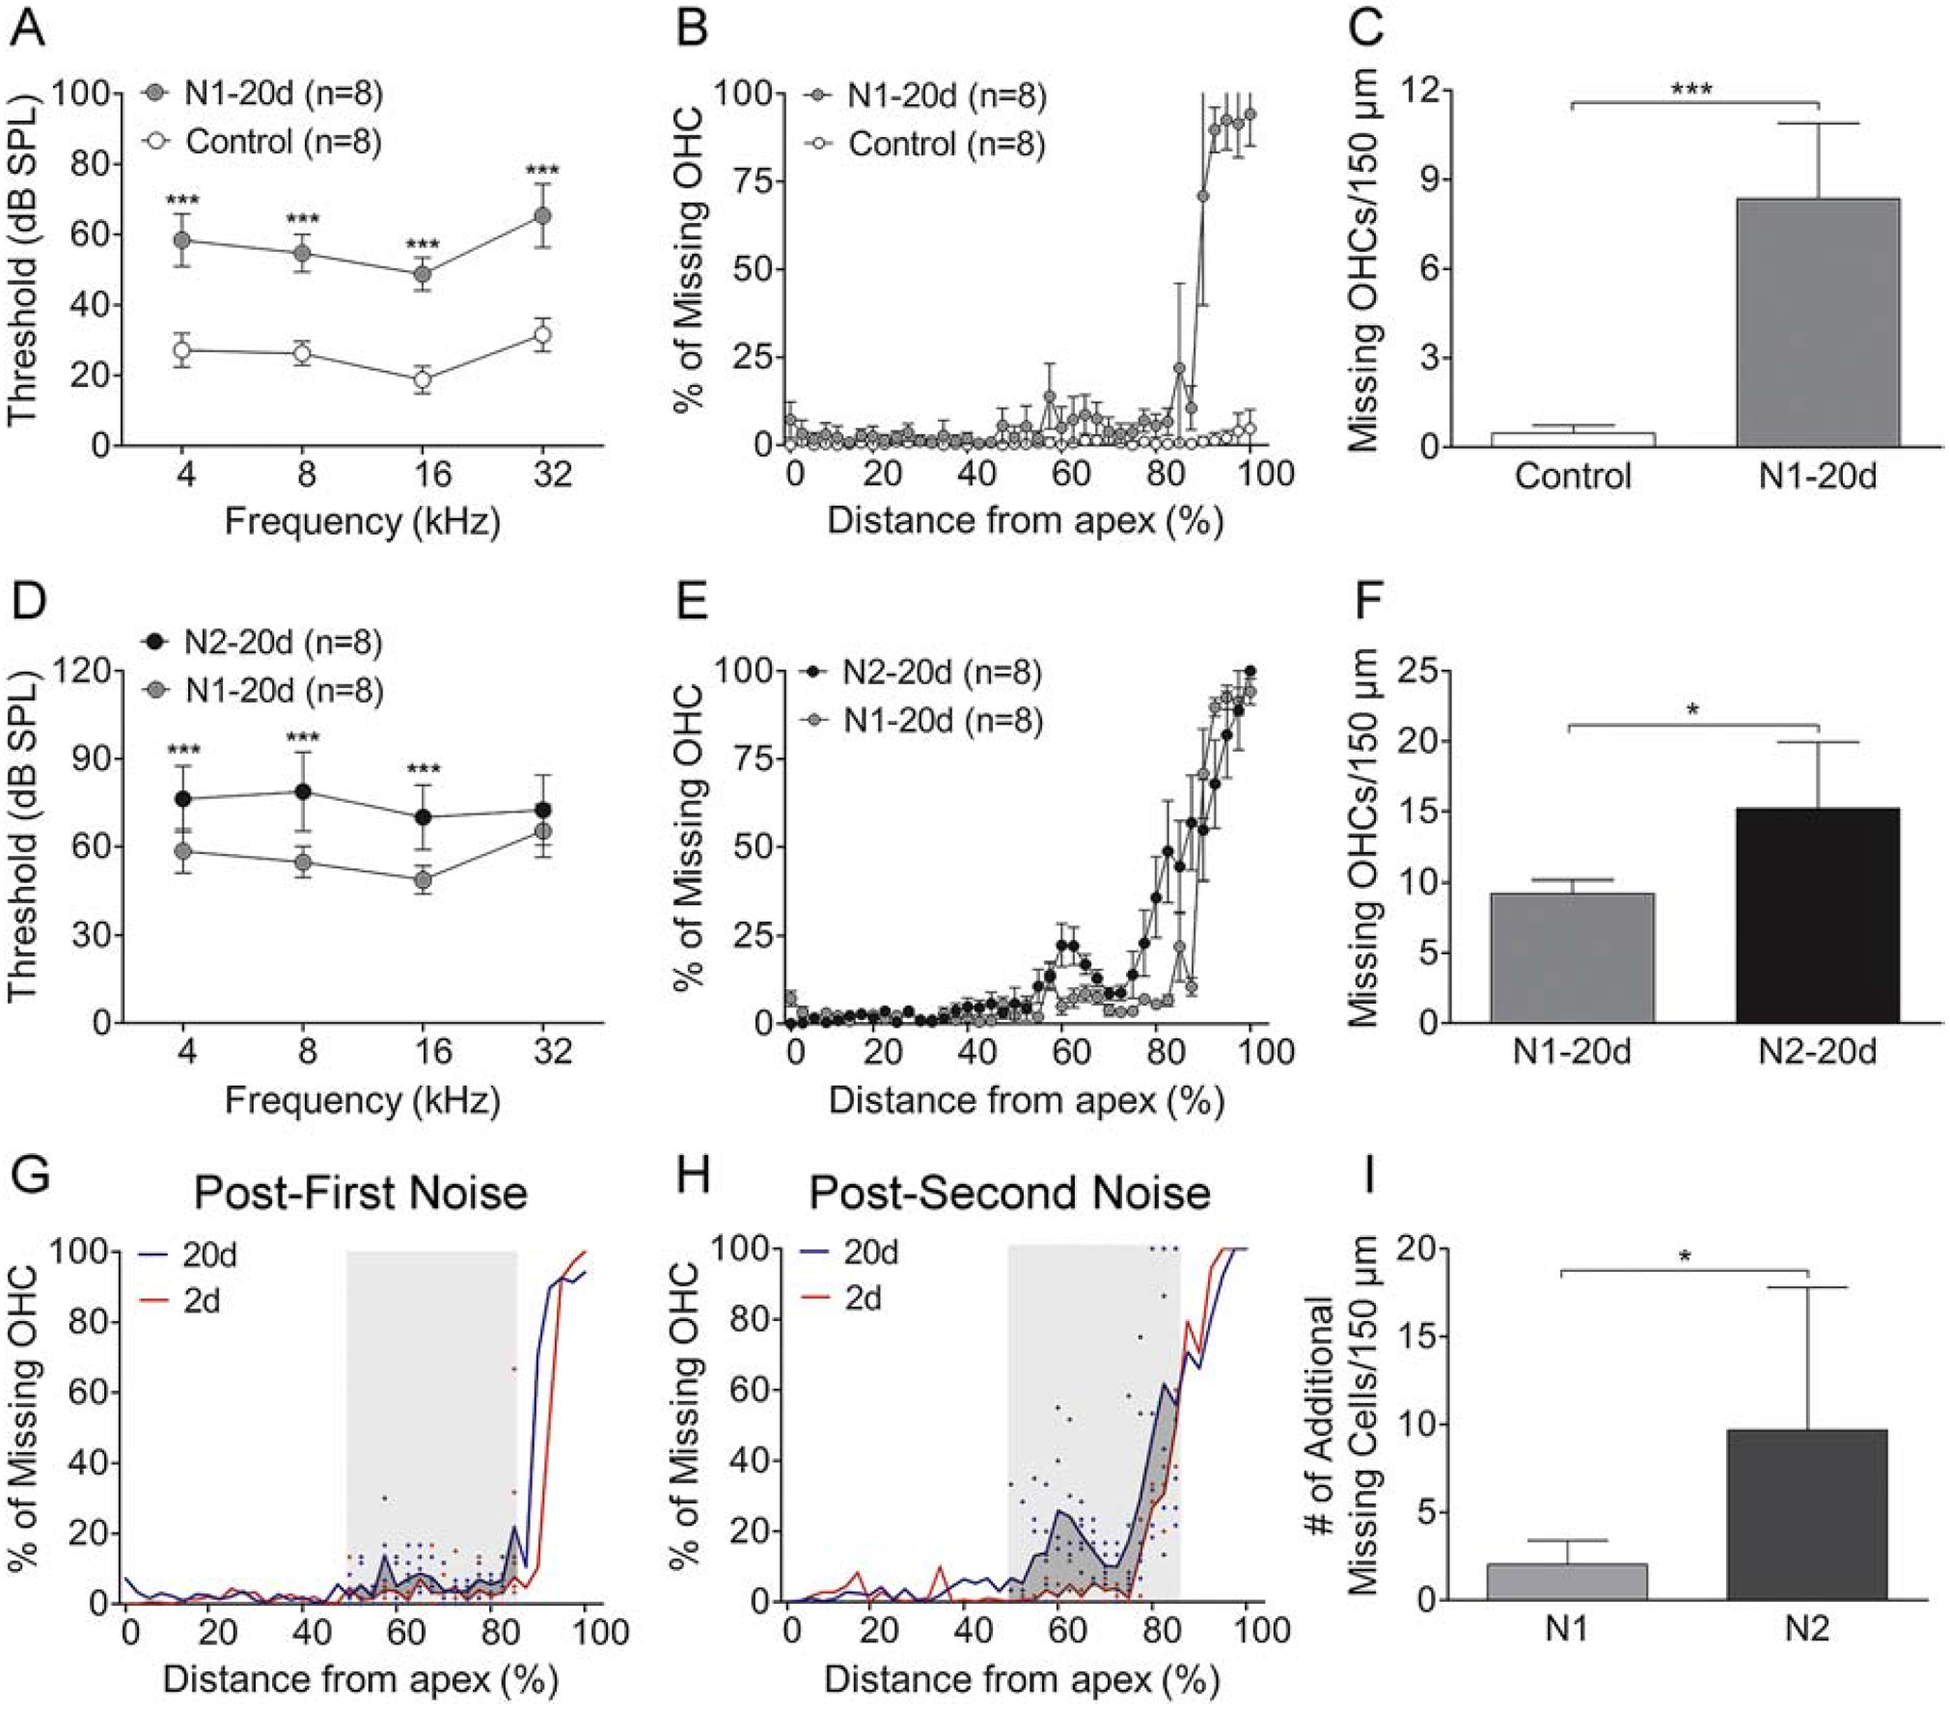
Figure 3. Comparison of ABR thresholds and sensory cell loss before and after the initial and the second noise exposure.

A. Comparison of mean ABR thresholds at the four tested frequencies before and 20 days after first noise exposure. Relative to the baseline thresholds, the thresholds are significantly elevated at 20 days after noise exposure (*** indicates P < 0.001). B. Cochleogram showing the distribution of OHC lesions along the basilar membrane. Notice that OHC lesions are confined in the basal end of the cochlea. C. Comparison of the average number of missing OHCs between the control and the noise group. There is a statistically significant increase in the number of missing OHCs per 150 μm at 20 days after noise exposure (* indicates P < 0.05). D. Comparison of ABR thresholds at the four tested frequencies before and 20 days after the second noise. As compared with the thresholds measured before the second noise exposure, i.e., 20 days after the first noise, the thresholds are significantly elevated at 20 days after the second noise exposure. E. Cochleogram showing the further expansion of OHC lesions into the middle region of the cochlea after the second noise exposure. F. Comparison of the average number of missing OHCs per 150 μm before (i.e., 20-days after the first noise exposure) and 20 days after the second noise exposure. A significant increase in the number of missing OHCs is present after the second noise exposure (* indicates P < 0.05). G and H. Cochleogram showing the level and the distribution of OHC loss along the basilar membrane at 2 and 20 days after the first noise exposure (G) or the second noise exposure (H). Notice that the second noise exposure results in a marked expansion of OHC lesions in the middle region of the cochlea, approximately 50–85% distance from the apex (marked by the gray area in G and H). I. Comparison of the increase in the number of missing cells between the N1 and the N2 group quantified in the region of the delayed damage marked by the gray areas in G and H. The level of the increase, which reflects the number of additional missing cells generated between 2- and 20-days post-noise, is greater after the second noise exposure compared to that observed after the first noise exposure (* indicates P < 0.05). n = 8 cochleae for each group for all graphs in this figure.
