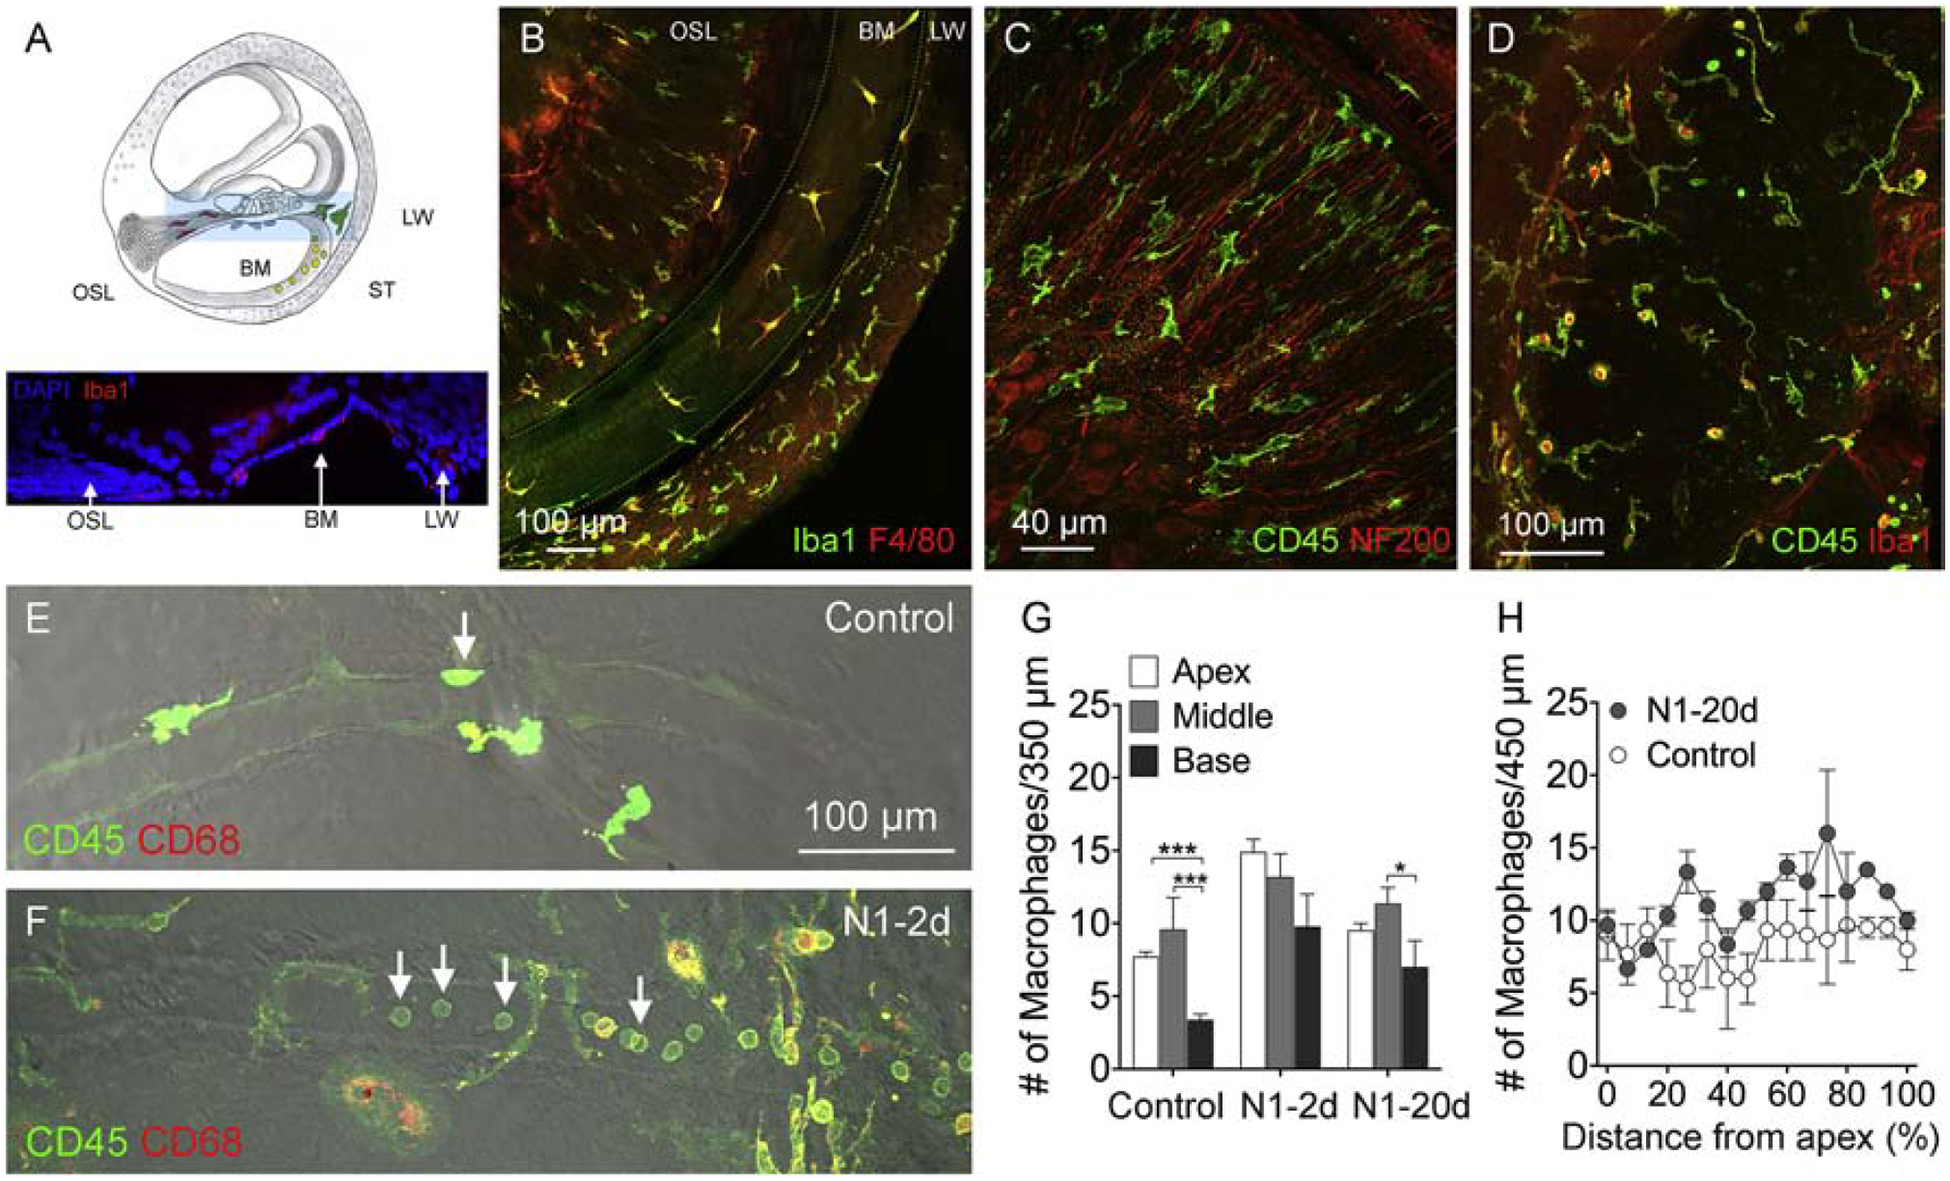
Figure 4. Acoustic overstimulation provokes a time-dependent expansion of the macrophage population.

A. Schematic of a side view of the cochlea illustrating the locations of cochlear macrophages examined in the current study. The osseous spiral lamina (OSL) macrophages reside among the peripheral fibers of the spiral ganglia. Basilar membrane (BM) macrophages reside on the scala tympani side of the basilar membrane. Scala tympani (ST) macrophages reside on the luminal surface of the scala tympani cavity. Inset shows a side viewof a cochlea labeled with DAPI (blue) and Iba1 (red). B. BM-macrophages enclosed by the dotted lines. This tissue was stained with Iba1 and F4/80. C. OSL-macrophages among the peripheral bundles of ganglion neurons. The location of the neural fibers is confirmed using neurofilament staining (red). Macrophages in this region have a branched shape and are oriented in parallel to the peripheral fibers of ganglion neurons. D. Macrophages on the luminal surface of the scala tympani illustrated by CD45 and Iba1 immunoreactivities. E and F. Microvessels on the luminal surface of the scala tympani in a control cochlea (E) and a noise-damaged cochlea from the N1–2d group (F) illustrated using the differential inference contrast (DIC) function on the confocal microscope. Immune cells are illustrated by CD45 (green) and CD68 (red) immunostaining. Notice that the microvessel in the control cochlea lacks immune cells. In contrast, the microvessel in the noise-damaged cochlea contains many small, round immune cells. G. Comparison of the number of macrophages between the control, N1–2d, and N1–20d group from the three cochlear partitions, basilar membrane, osseous spiral lamina, and luminal surface of the scala tympani. When combining macrophage numbers for all examined cochlear partitions, the number of total macrophages is significantly increased at 2-days after the noise exposure and partially recovers at 20-days after noise exposure. (** indicates P < 0.01 and *** indicates P < 0.001). n = 6 biological replicates for each group. H. Macrophage-gram showing the distribution of basilar membrane macrophages along the cochlear spiral. The increase is more pronounced in the middle and basal regions of the cochlea. n = 4 biological replicates for each group.
