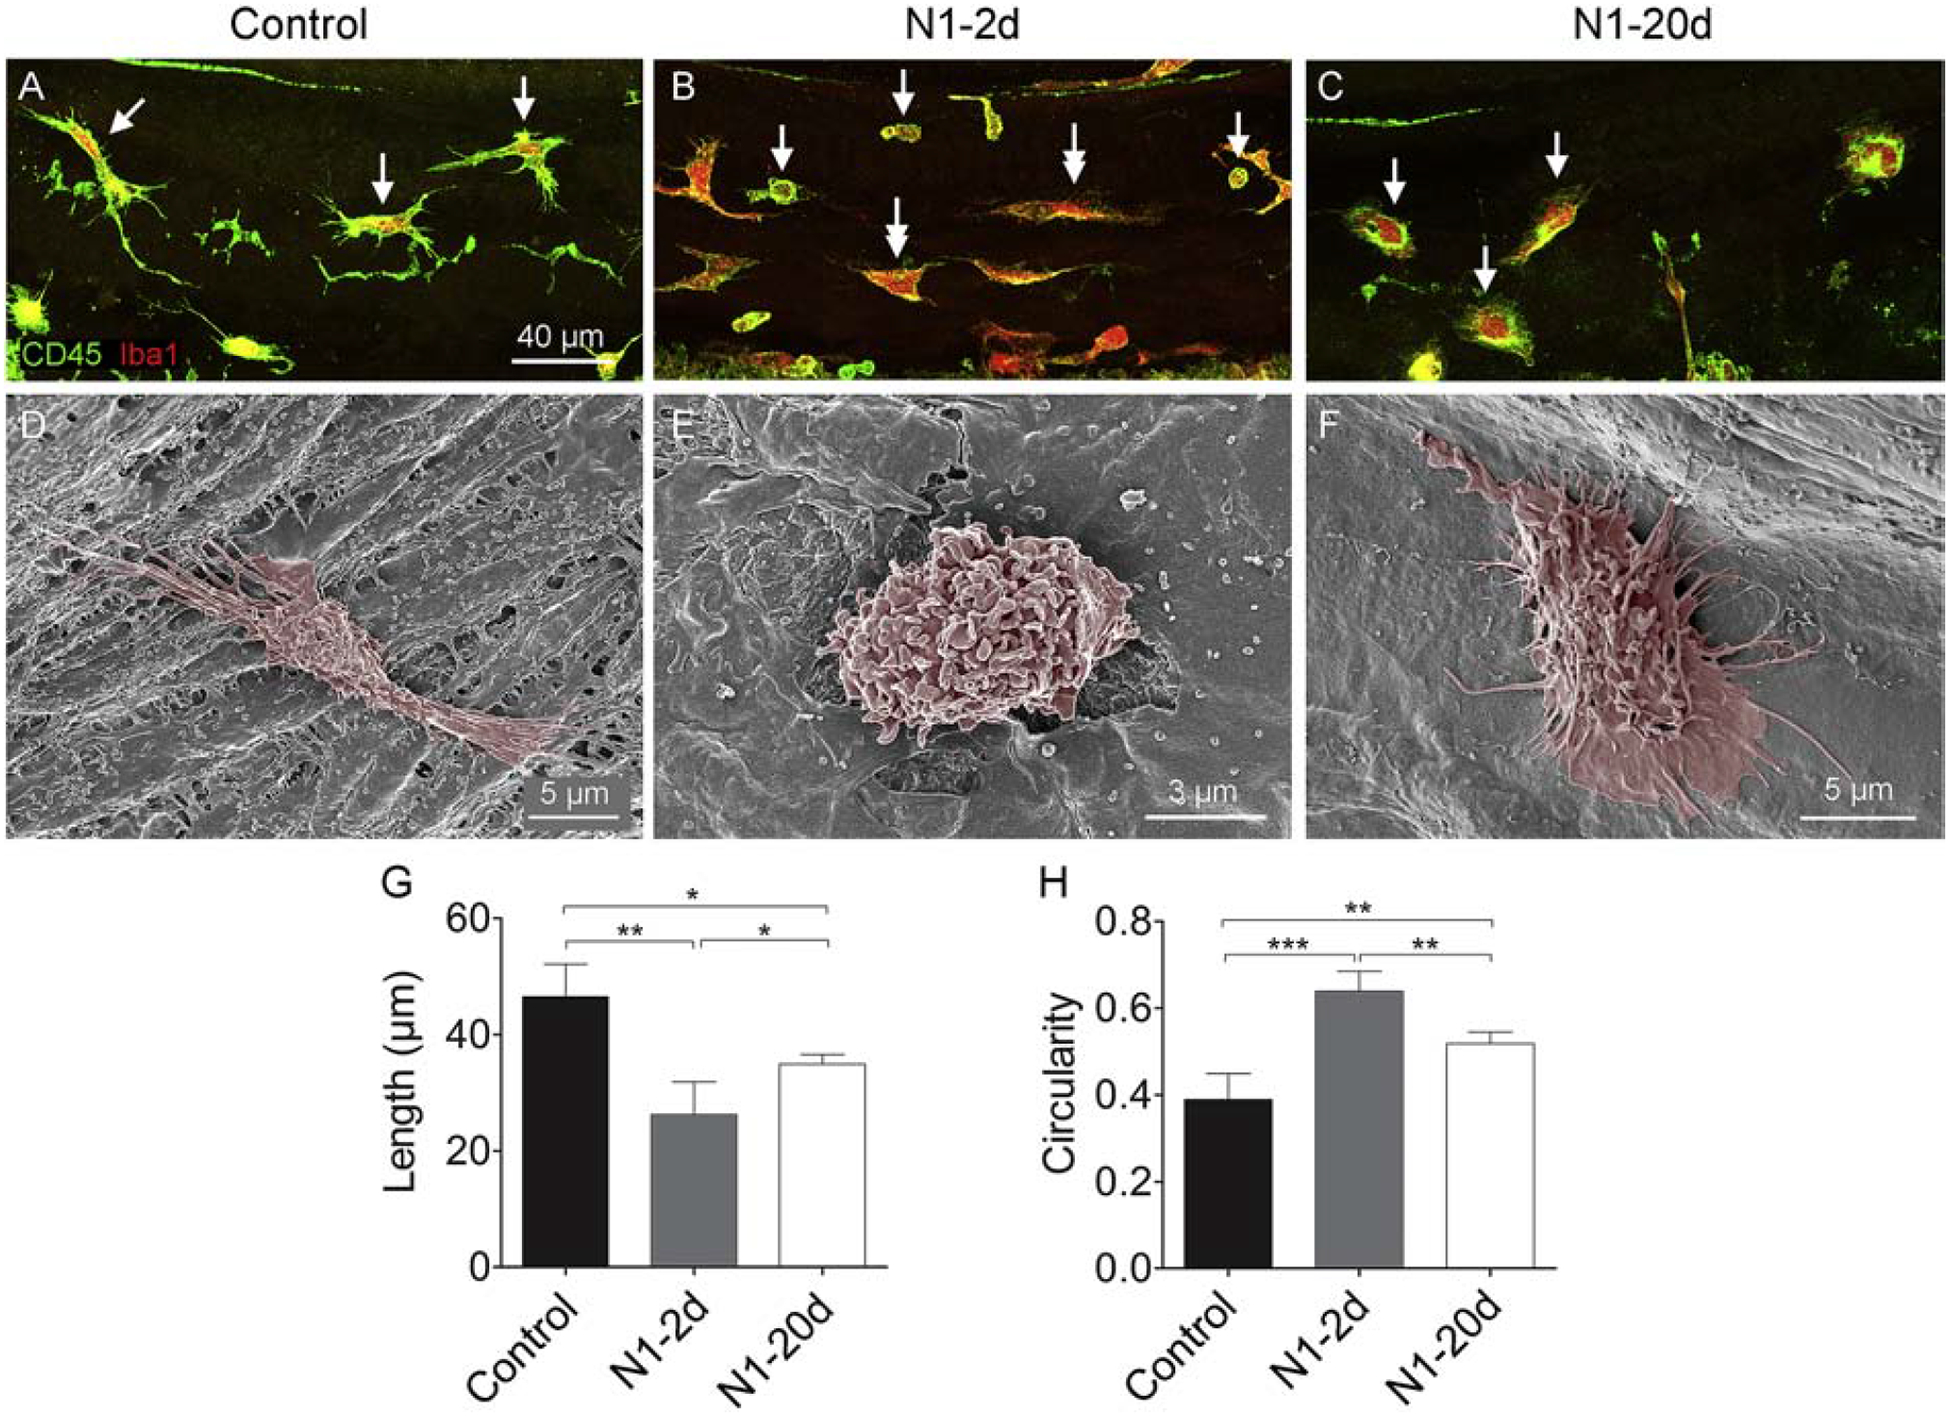
Figure 5. Acquisition of the activated morphology of basilar membrane macrophages after acoustic overstimulation.

A. Macrophages in the basilar membrane in the middle portion of the cochlea present with a tree-trunk morphology with fine, thin processes (arrows) in a control cochlea. B. Macrophages in a cochlea examined at 2-days after noise exposure. Single-arrows point to the cells with monocyte-like phenotypes: small size with a round shape. These cells are likely newly infiltrated monocytes. Double-arrows indicate cells with the mature macrophage morphology. These cells display a reduced length and have less thin processes as compared with the macrophages observed in the control ears. C. Macrophages in a cochlea examined at 20-days after noise exposure. Notice that macrophages present with a flat, spread morphology or an amoeboid shape with multiple protrusions or fine and short dendritic projections (arrows). D-F. Typical SEM images of basilar membrane macrophages from the middle region of cochleae from the control and the two noise groups. G. Comparison of the macrophage length between the control, N1–2d, and N1–20d groups. There is a significant reduction in the average length of macrophages at 2-days after noise exposure and a partial recovery by 20-days (* indicates P < 0.05 and ** indicates P < 0.01). The reduction of the cell length indicates the retraction of macrophage processes. H. Comparison of macrophage circularity between the control, N1–2d, and N1–20d groups. Cell circularity displays a significant increase at 2-days after noise exposure and a partial recovery at 20-days after noise exposure. The increase in the value of circularity indicates the amoeboid transformation of macrophages (** indicates P < 0.01 and *** indicates P < 0.001). n = 5 biological replicates for each group.
