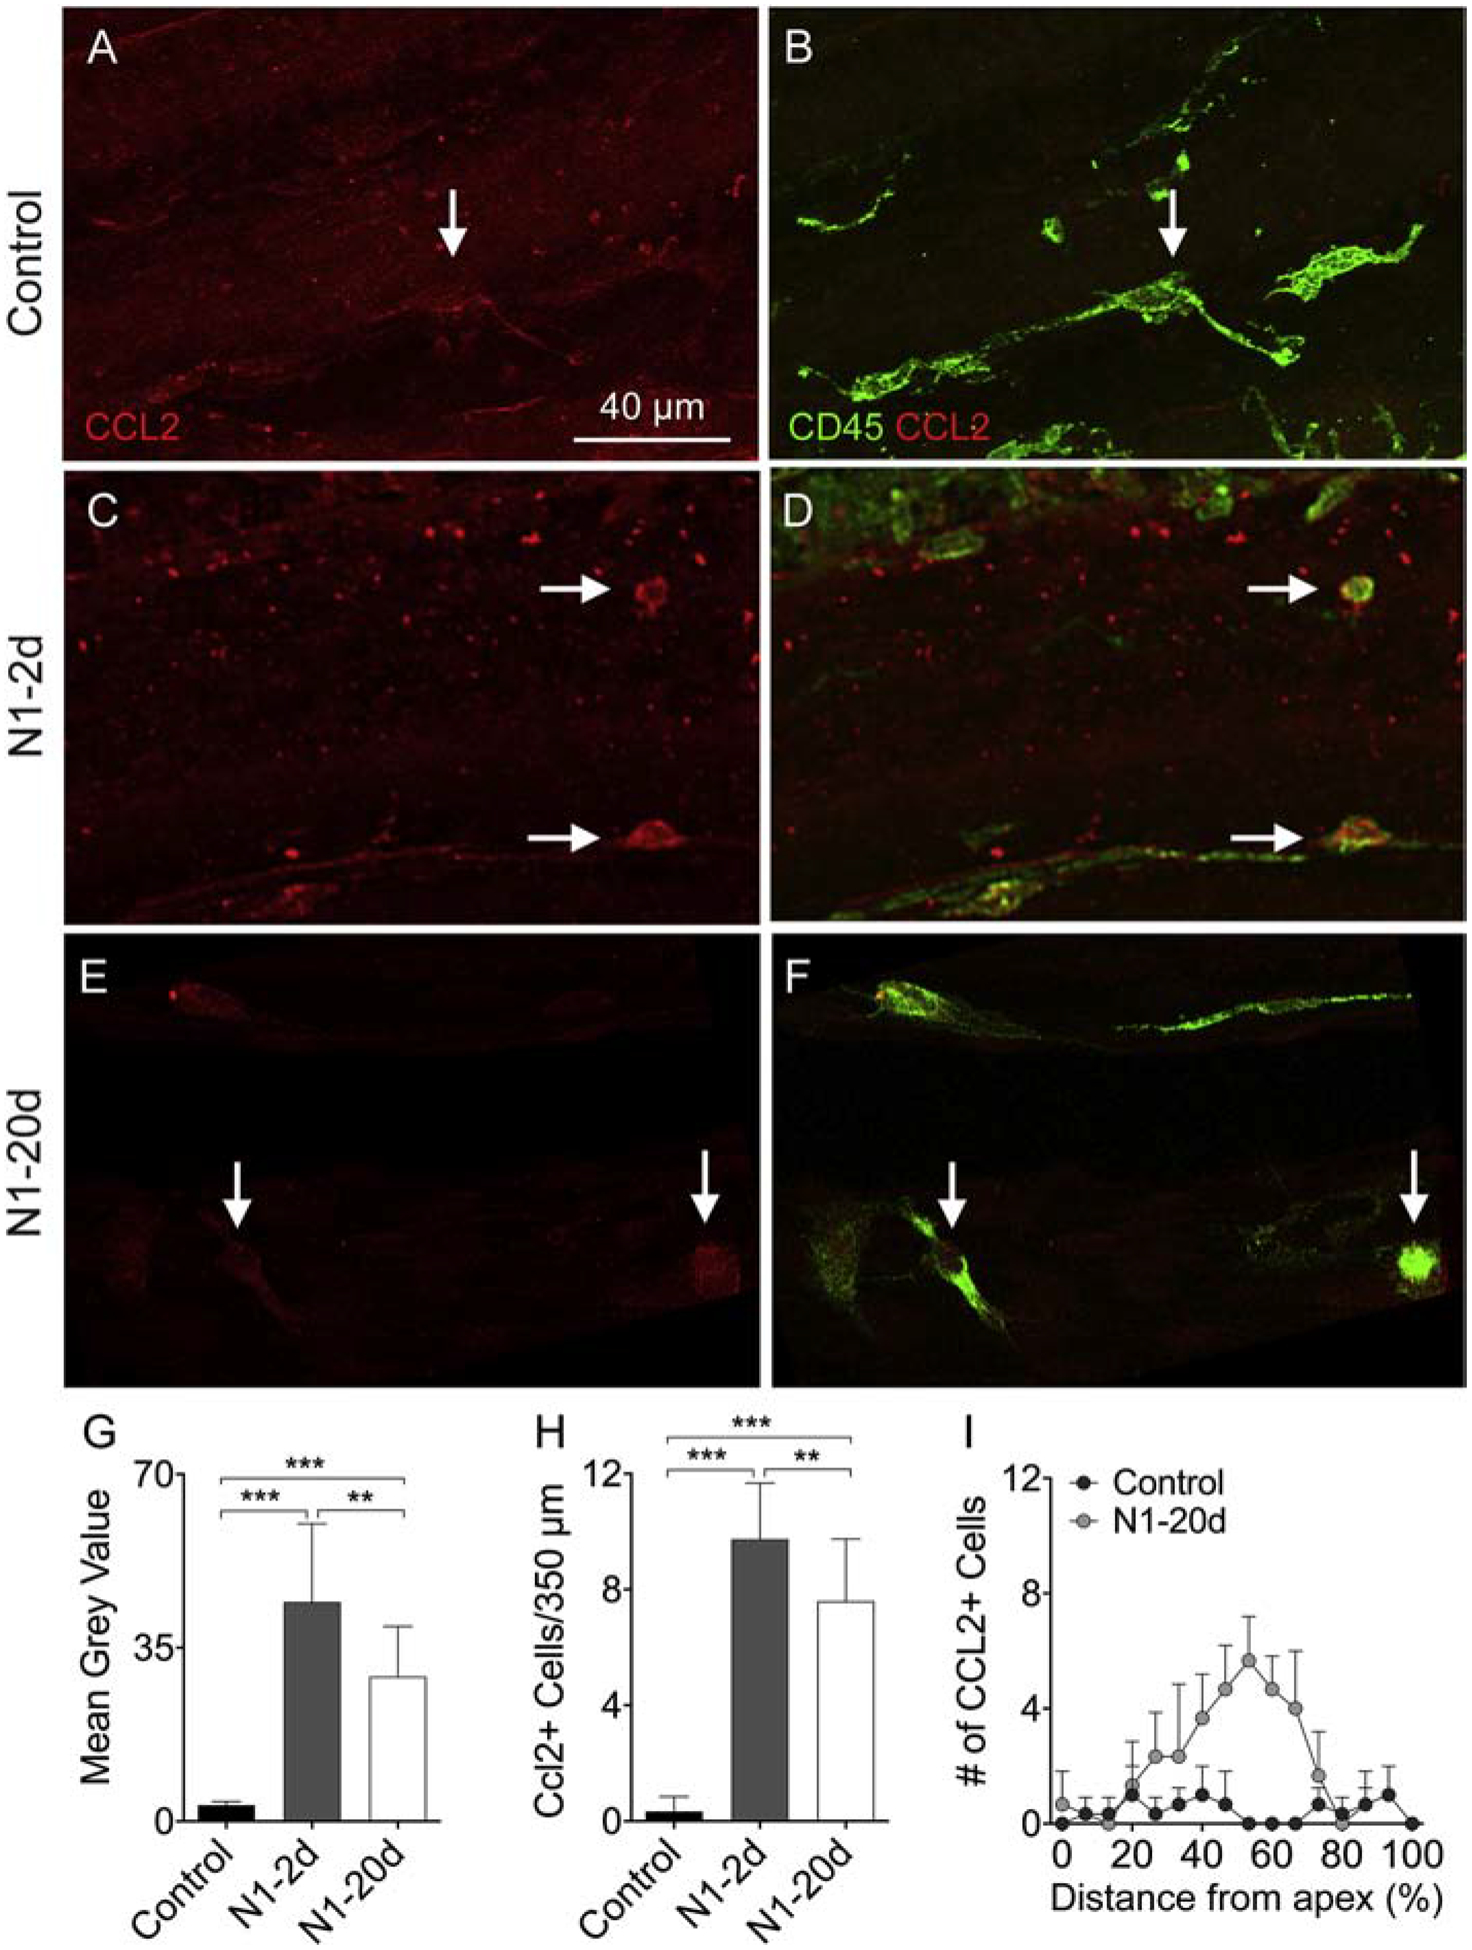
Figure 6. Upregulation of CCL2 in basilar membrane macrophages after acoustic overstimulation.

A-B. CCL2 immunoreactivity in basilar membrane macrophages of a control ear. Panel A shows CCL2 immunoreactivity and panel B shows the merged view of CCL2 and CD45. The arrow points a macrophage with weak CCL2 immunoreactivity that is barely visible. C-D. CCL2 immunoreactivity in macrophages examined at 2-days after noise exposure. Arrows indicate small, round macrophages that display strong CCL2 immunoreactivity. E-F. CCL2 immunoreactivity in macrophages examined at 20-days after noise exposure. CCL2 immunoreactivity is still visible in macrophages. G. Comparison of the level of CCL2 immunoreactivity in macrophages among the control, N1–2d, and N1–20d groups. The N1–2d group displays a marked increase in CCL2 immunoreactivity as compared with the control group. The increase is partially decreased in the N1–20d group (** indicates P < 0.01 and *** indicates P < 0.001). H. Comparison of the number of CCL2-positive macrophages between the control, N1–2d, and N1–20d groups. The number of CCL2-positive cells is increased at 2-days after noise exposure, and this increase partially recovers at 20-days after noise exposure (** indicates P < 0.01 and *** indicates P < 0.001). I. Macrophage-gram showing the distribution of CCL2 positive cells along the basilar membrane. Notice that these positive cells are mainly distributed in the middle region (30–70% distance from the apex). n = 5 biological replicates for each group.
