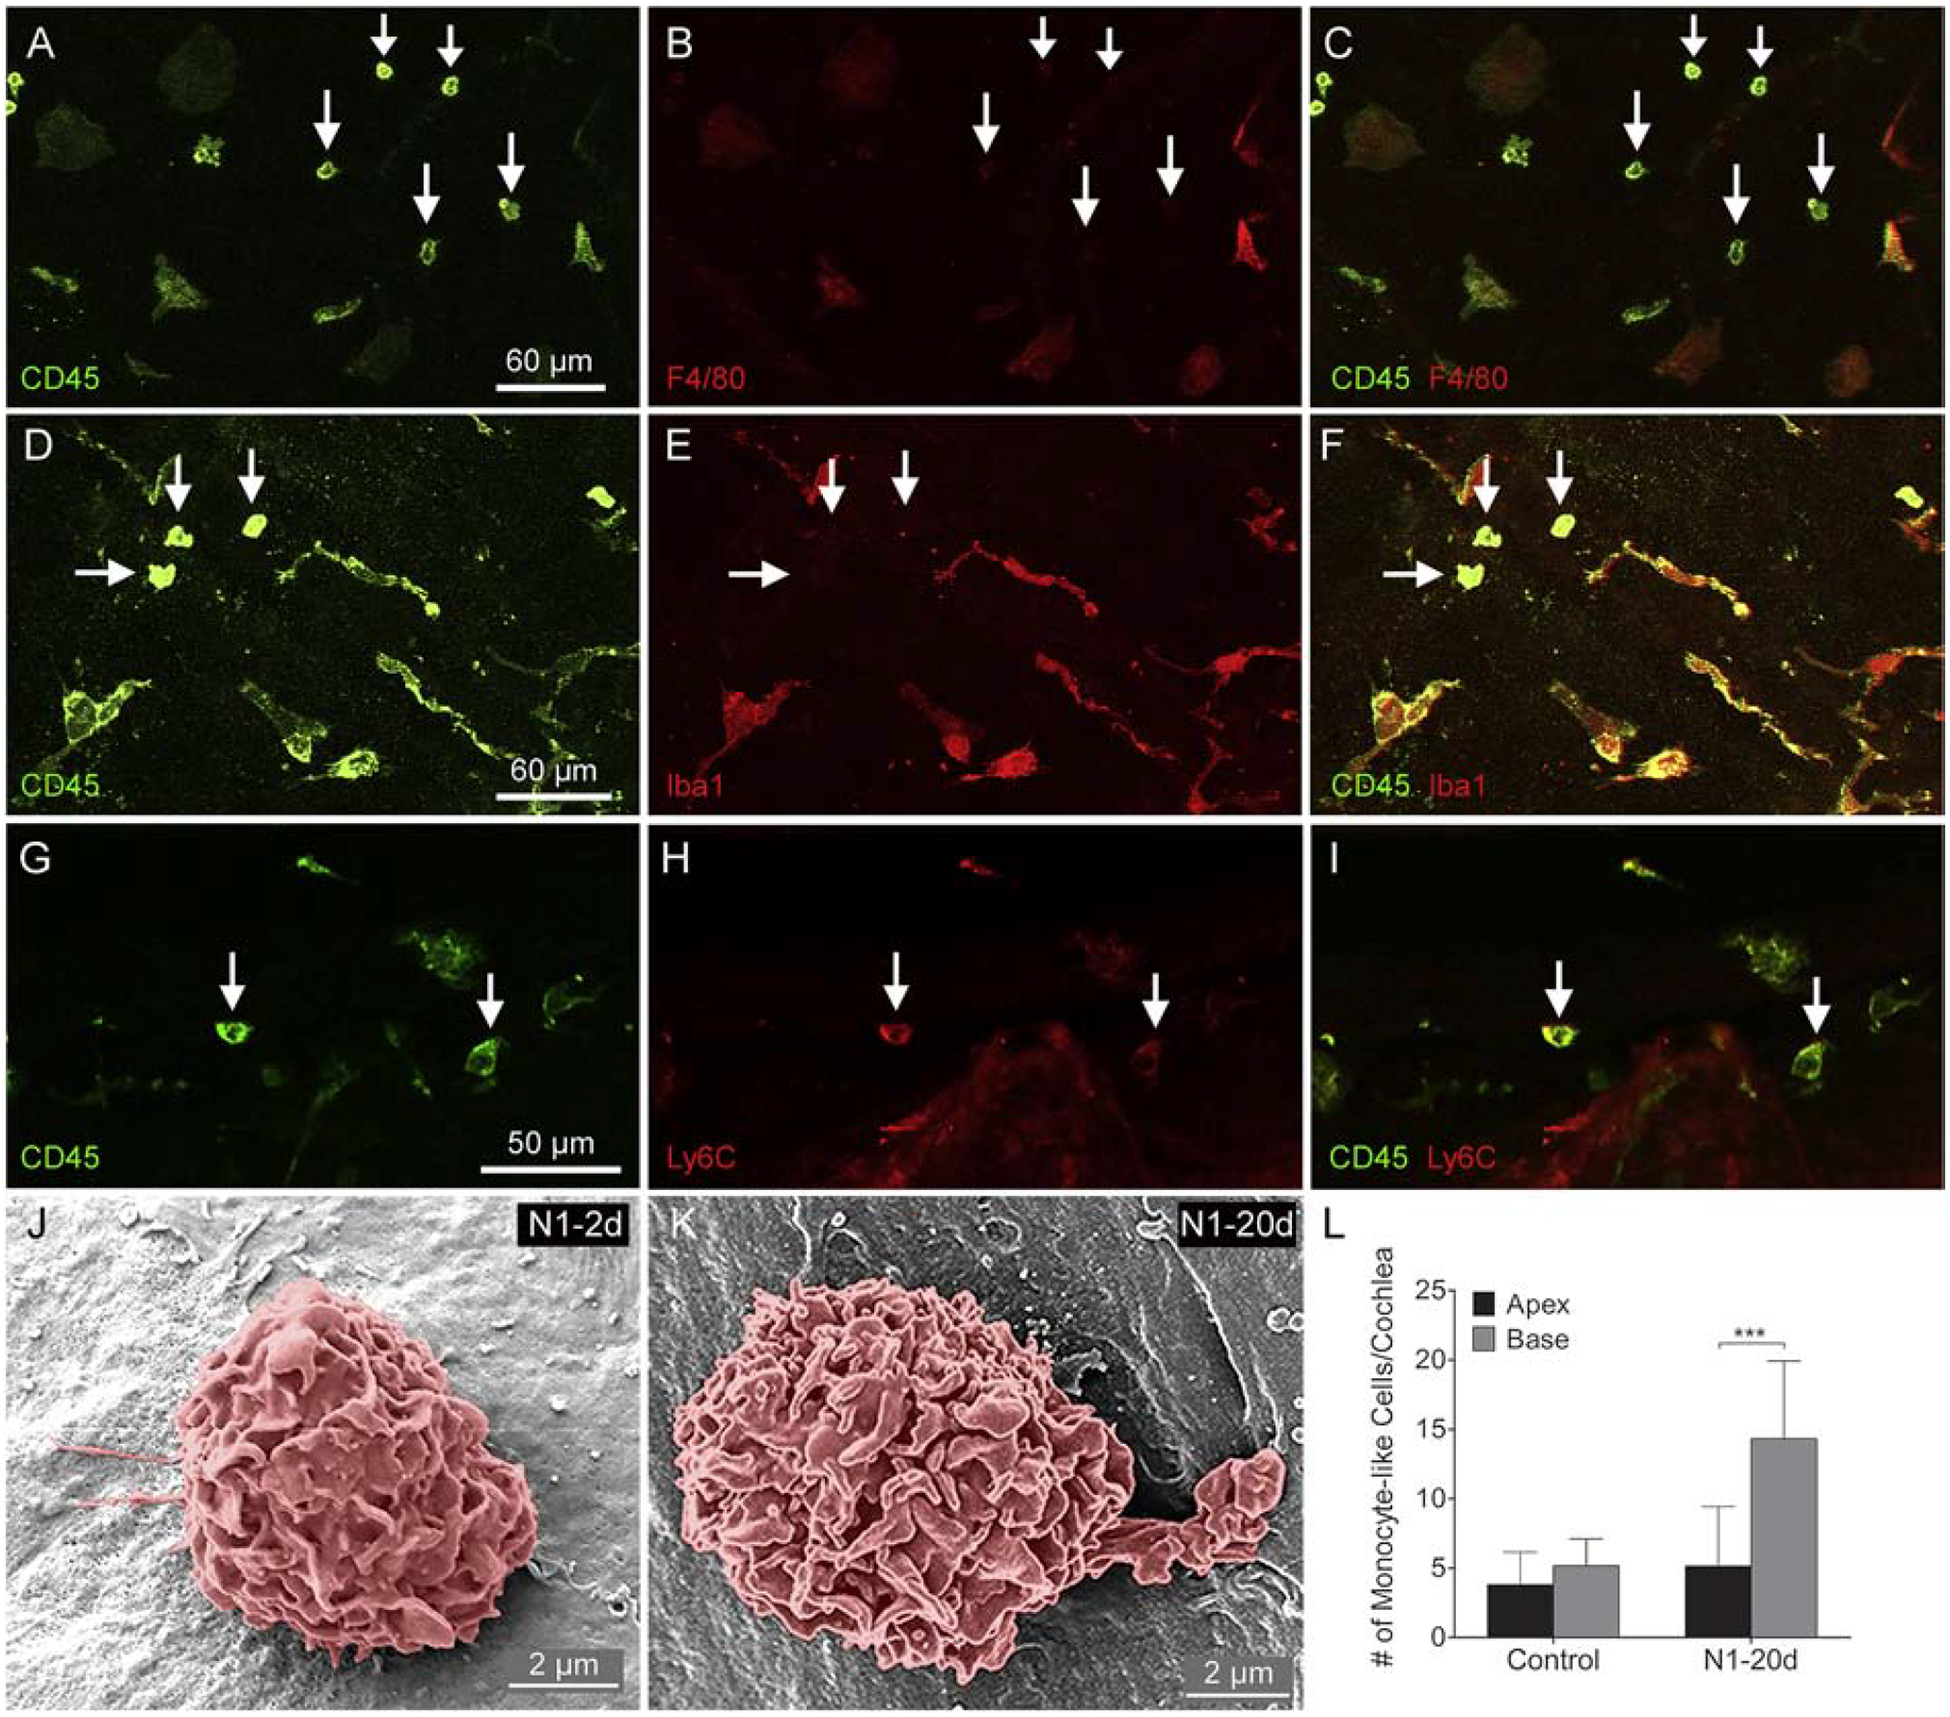
Figure 7. Phenotyping of immune cells with the monocyte morphology at 20-days after noise exposure.

A-C. Double-staining of CD45 and F4/80. Small round CD45high cells are F4/80l°w. D-F. Double-staining of CD45 and Iba1. Small round CD45high cells are Iba1l°w. G-I. Double-staining of CD45 and Ly6C. Small round cells display both CD45 and Ly6C immunoreactivity. J-K. Scanning electron micrographs of monocyte-like cells from cochleae in the N1–2d and N1–20d group. These cells have the surface contour of the monocyte. L. Comparison of the number of small, round monocyte-like cells between the apical and the basal region of the cochleae. There is no difference between the number of monocyte-like cells between the apex and the base of the control cochleae. In contrast, the number of small, round cells is significantly higher in the base compared to that in the apex in the N1–20d (*** indicates P < 0.001). n = 4 biological replicates for each group.
