
Figure 1. A 3D Differentiation System for Generating Blastocyst-like Structures from EPS Cells.
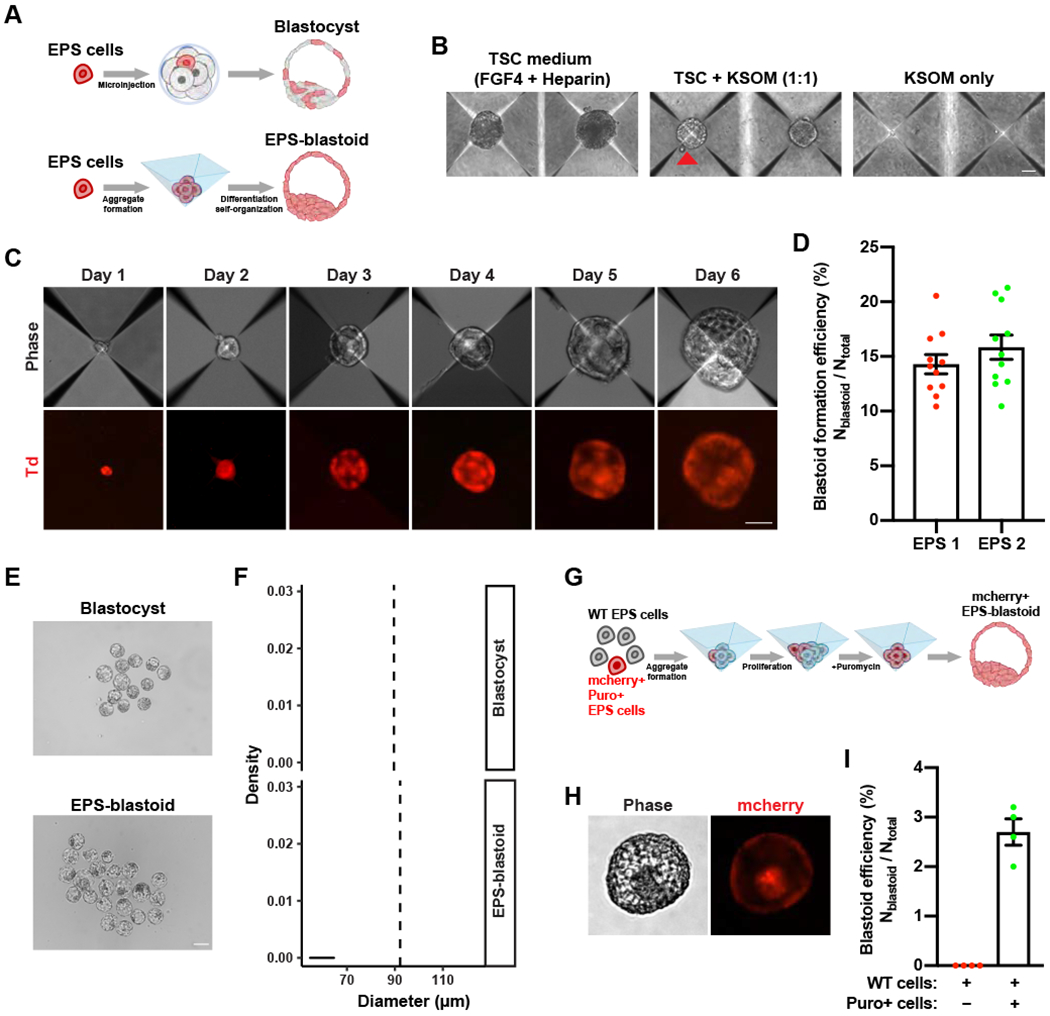
(A) Top panel: A diagram showing that a single EPS cell can contribute to both embryonic (Em) and extraembryonic (ExEm) lineages in the blastocyst after injection into an 8-cell embryo. Bottom panel: A diagram showing that EPS cells differentiate and self-organize into an EPS-blastoid.
(B) Phase contrast images of EPS cell aggregates cultured in the indicated medium conditions for four days. The red triangle indicates an EPS-blastoid.
(C) Representative phase contrast (upper panel) and fluorescence images (lower panel) of EPS cell aggregates at the indicated time point showing the formation of EPS-blastoids. Phase, phase contrast; Td, tdTomato.
(D) Quantification of EPS-blastoids formation efficiency. n = 11 independent assays for each EPS cell line.
(E) Phase contrast images of E3.5 blastocysts (upper panel) and EPS-blastoids (lower panel).
(F) Histograms showing the distribution of the diameters of E3.5 blastocysts (upper panel) and EPS-blastoids (lower panel). n = 55 blastocysts and n = 95 EPS-blastoids. The vertical dotted line denotes the mean of the group.
(G) A diagram showing the strategy for a single EPS cell to generate a clonal EPS-blastoid.
(H) Phase contrast (left) and fluorescent (right) images of an EPS-blastoid generated using the strategy shown in (G).
(I) Quantification of EPS-blastoids formation efficiency in the assay described in (G). n = 4 independent assays.
Data are represented as mean ± SEM. Scale bars, 50 μm (B, C), 100 μm (E), 20 μm (H).