
Figure 2. EPS-blastoid Formation Recapitulates Key Preimplantation Developmental Processes.
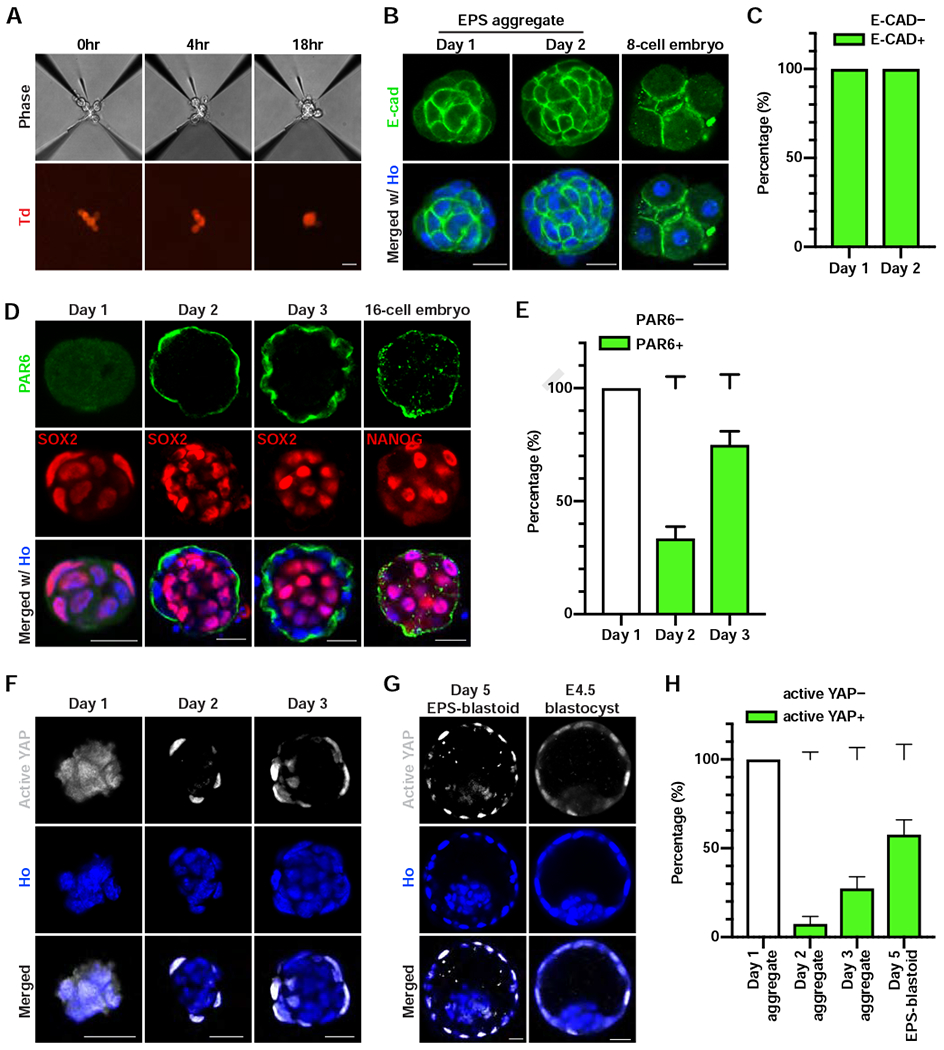
(A) Phase contrast (upper panel) and fluorescent (lower panel) images of EPS cells at the indicated time after cell seeding. Td, tdTomato.
(B) Immunofluorescence staining of an EPS aggregate at day 1 (left), day 2 (middle), and a compacted 8-cell embryo (right) for E-cadherin (E-CAD).
(C) Quantification of the percentage of cell aggregates showing E-CAD+ staining at the indicated day. n = 3 biological replicates for each time point.
(D) Immunofluorescence staining of EPS aggregates at the indicated time points and 16-cell embryos for PAR6 and SOX2 or NANOG.
(E) Quantification of the percentage of cell aggregates showing a PAR6 ring at the indicated time points. n = 3 biological replicates for each time point.
(F and G) Immunofluorescence staining for active YAP in EPS aggregates at the indicated time point (F), an EPS-blastoid (G), and an E4.5 blastocyst (G).
(H) Quantification of the percentage of structures showing active YAP+ at the indicated time points. n = 3 independent assays for day 1, day 2 aggregates, and day 5 EPS-blastoids; n = 5 independent assays for day 3 aggregates.
Data are represented as mean ± SEM. Scale bars, 20 μm. Ho, Hoechst.