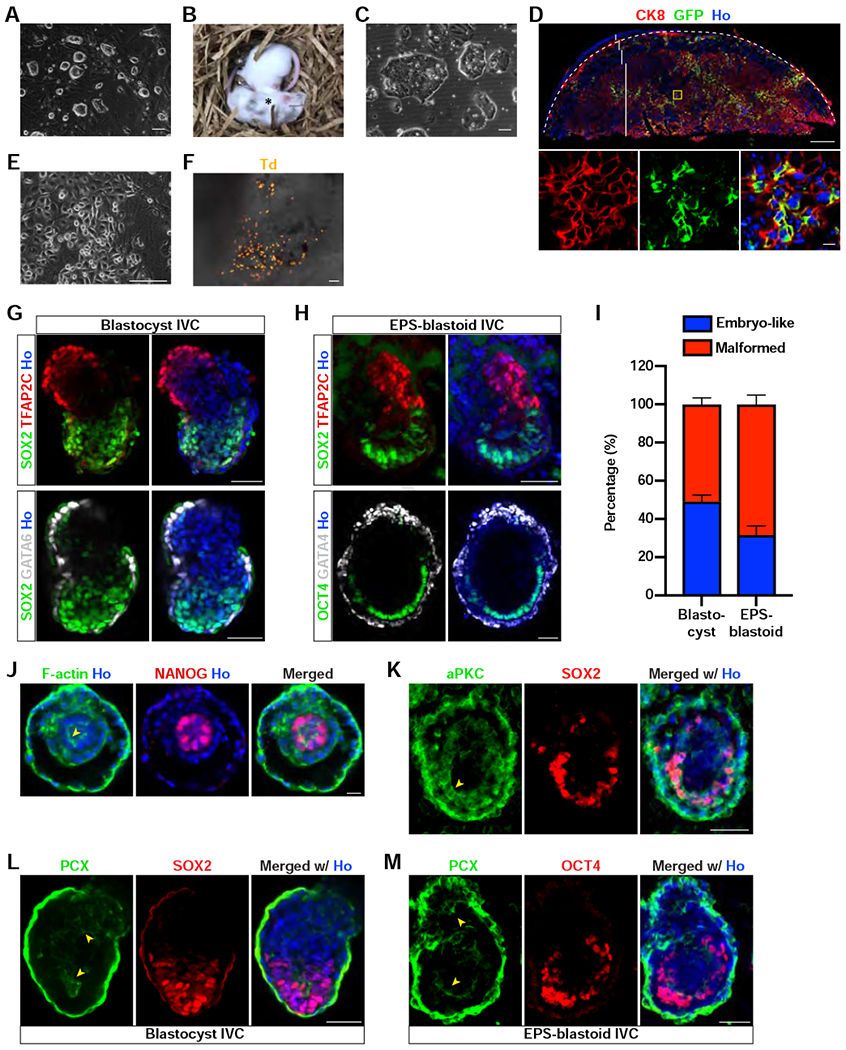
Figure 5. In Vitro Developmental Potential of EPS-blastoids.

(A) Phase contrast image of de novo derived ES cell lines from EPS-blastoids.
(B) Brightfield image of two littermates generated from blastocyst injected with EPS-blastoid-derived ES cells showing that these cells can contribute to chimeric mice. The star symbol denotes a chimeric mouse.
(C) Phase contrast image of de novo derived TS cell lines from EPS-blastoids.
(D) Immunofluorescence staining of a placental section for CK8 and GFP. The panels below are the enlargement of the yellow boxed region. The placenta was delineated by a dotted line; dec, decidua layer; gc, giant cell layer; sp, spongiotrophoblast layer; laby, labyrinth layer.
(E) Phase contrast image of de novo derived XEN cell lines from EPS-blastoids.
(F) Brightfield image of a yolk sac overlaid with tdTomato epifluorescence image showing EPS-blastoid-derived XEN cells can contribute to the developing yolk sac. Td, tdTomato.
(G) Immunofluorescence staining of blastocyst-derived postimplantation embryo-like structures for TFAP2C and SOX2 (upper panel) or GATA6 and SOX2 (lower panel).
(H) Immunofluorescence staining of EPS-blastoid-derived postimplantation embryo-like structures for TFAP2C and SOX2 (upper panel) or GATA4 and OCT4 (lower panel).
(I) Quantification of the percentage of postimplantation embryo-like and malformed structures formed after in vitro culture of blastocysts and EPS-blastoids. n = 3 and 4 independent assays for blastocysts and EPS-blastoids, respectively.
(J) Immunofluorescence staining of an EPS-blastoid-derived peri-implantation embryo-like structure for F-actin and NANOG showing the formation of rosette EPI-like structure.
(K) Immunofluorescence staining of an EPS-blastoid-derived postimplantation embryo-like structure for aPKC and SOX2. Yellow arrowhead denotes the apical domain.
(L and M) Immunofluorescence staining of a blastocyst- (L) or an EPS-blastoid- (M) derived postimplantation embryo-like structure for PCX and SOX2 (L) or PCX and OCT4 (M). Yellow arrowheads denote the enrichment of PCX protein around the lumens in both the EPI and ExE-like structure. PCX, podocalyxin.
Data are represented as mean ± SEM. Scale bar, 500 μm (D, upper), 100 μm (A, C, E, and F), 50 μm (G, H, K, L, and M), 20 μm (D, bottom; and J). Ho, Hoechst.
See also Figure S5.
