
Figure 6. In Vivo Developmental Potential of EPS-blastoids.
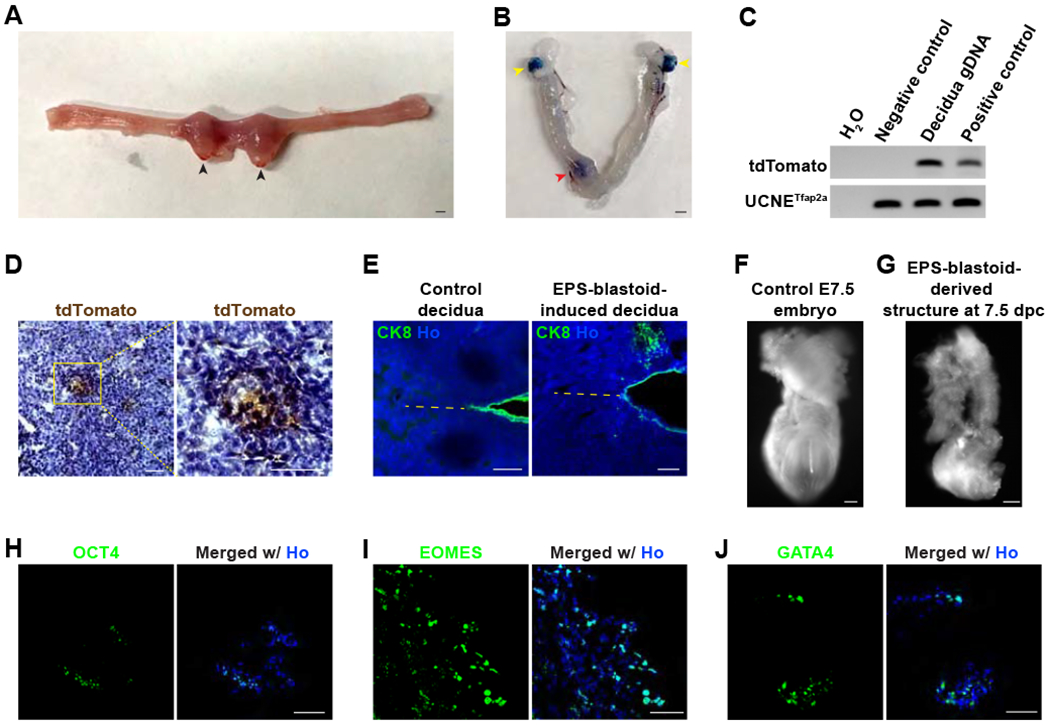
(A) Brightfield image showing the formation of decidua in the mouse uterus 5 days after EPS-blastoids transfer at 2.5 dpc. Black arrowheads indicate deciduae.
(B) Brightfield image of a mouse uterus 5 days after EPS-blastoids transfer at 2.5 dpc with Evan’s blue staining. The red arrowhead indicates a decidua. Yellow arrowheads denote the ovaries.
(C) PCR analysis of genomic DNA for the tdTomato gene reveals the presence of EPS-blastoid-derived cells in the decidua tissue. UCNETfap2a was used as an internal loading control.
(D) Immunohistochemistry analysis of decidua sections showing the decidua contains EPS-blastoid-derived tdTomato+ cells. The image on the right is the enlargement of the yellow box region.
(E) Immunofluorescence staining of a section from control decidua (left) or EPS-blastoid-induced decidua (right) for CK8. The dotted line indicates the embryonic axis. AM, antimesometrial pole; M, mesometrial pole.
(F and G) Brightfield images of a control E7.5 embryo (F) or an in vivo EPS-blastoid-derived structure recovered from decidua at 7.5 dpc (5 days after EPS-blastoids transfer) (G).
(H - J) Immunofluorescence staining of sections from an in vivo EPS-blastoid-derived structure recovered from decidua at 7.5 dpc (5 days after EPS-blastoids transfer) for OCT4 (H), EOMES (I), and GATA4 (J).
Scale bar, 1 mm (A, and B), 100 μm (D, E, F, and G), and 50 μm (H, I, and J). Ho, Hoechst.