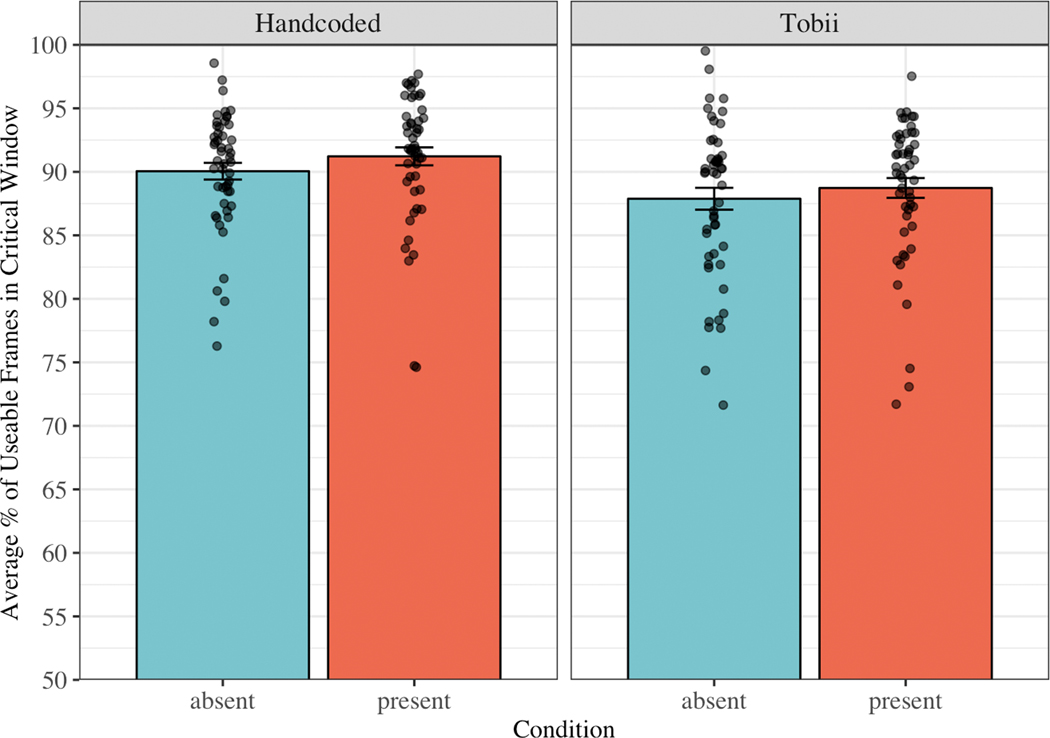
Figure 3.
Mean proportion of time points during the analysis window (300–2000ms after noun onset) in which children were looking at the images, separated by source (Handcoded = manual gaze coding; Tobii = automatic eye tracking) and condition (Target Absent vs. Target Present). Dots represent the mean for each child. The bars represent +/− one standard error above and below the mean.

