
FIGURE 3.
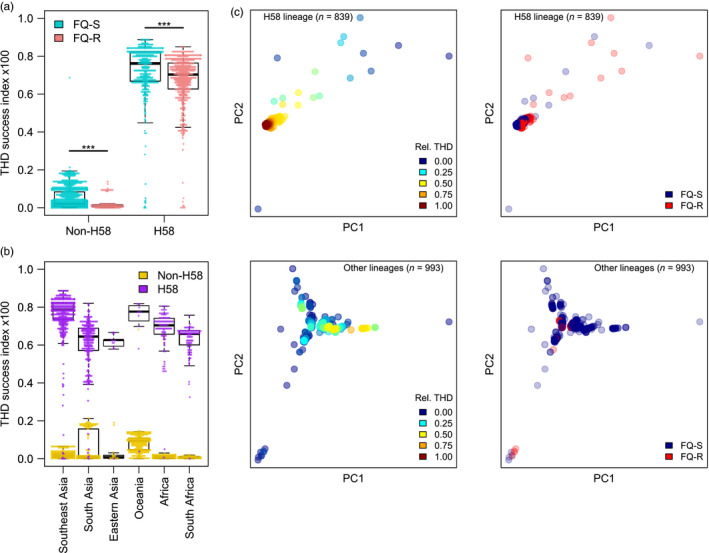
Distribution of the THD success index in Salmonella Typhi H58 and non‐H58 isolates depending on chromosomal fluoroquinolone resistance (a) and geographic origin (b). (c) Genetic principal coordinate plots illustrate lack of overlap between higher THD values (left column) and fluoroquinolone resistance (right column) both in H58 and non‐H58 lineages (upper and lower rows, respectively). ***p < .001, Mann–Whitney U test