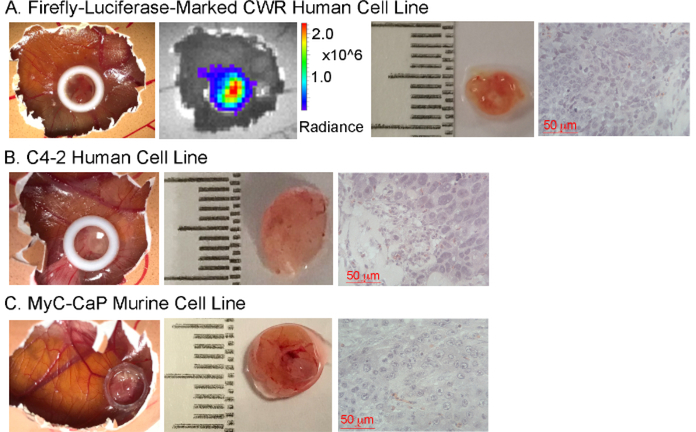
Figure 3: Representative tumor development from prostate cancer cell lines.
Representative tumors and hematoxylin and eosin staining resulting from the implantation of the human prostate cancer cell lines (A) CWR and (B) C4–2 along with the murine cell line (C) MyC-CaP. Bioluminescence imaging of the resulting tumors from firefly luciferase marked CWR cells is shown in (A). The measurement scale adjacent to the excised tumors shows 1 mm markings.

