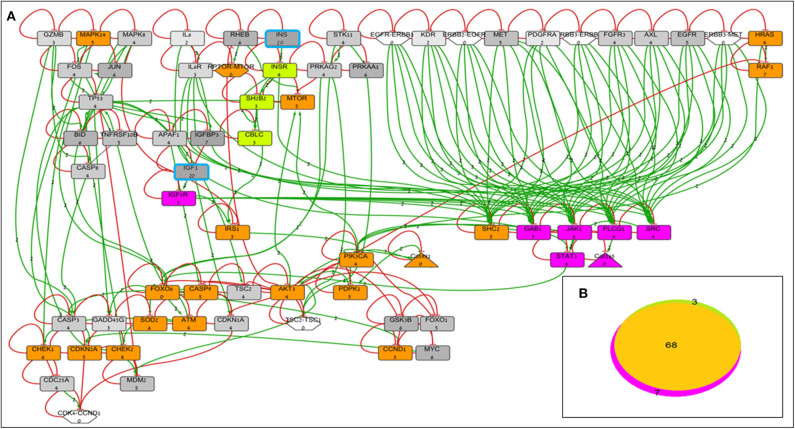
Figure 2.
BioNSi network and simulation analyses of MCF7-derived breast cancer cell lines. (A) Reduced network of 68 genes (only biologically tested genes and their neighbors), colored according to their initial expression value (grayscale). The initial expression value is written underneath each gene name. INS and IGF1 expression was manually set as very high (20), and genes are highlighted in turquoise frame. Complexes initial expression is zero by BioNSi default. Activation arrow edges are colored green. Inhibition edges are colored red with flat heads. Simulation analyses were performed on the complete network (385 genes). Node's background was changed after simulations: genes whose expression changed during simulation in both KD cells are colored orange; genes whose expression changed during simulation only in IGF1R-KD cells are colored purple; and genes whose expression changed during simulation only in INSR-KD cells are colored green. (B) Venn diagram of numbers of genes whose expression changed during simulation (specific KD vs. control). Nodes whose expression changed only in IGF1R-KD cells are colored purple (IGF1R, STAT3, GAB1, JAK1, PLCG1, SRC, and diacylglycerol). Genes whose expression changed during simulation only in INSR-KD are colored green (INSR, SH2B2, and CBLC). Overlapping genes whose expression changed during simulation in both KD cells are colored orange.

