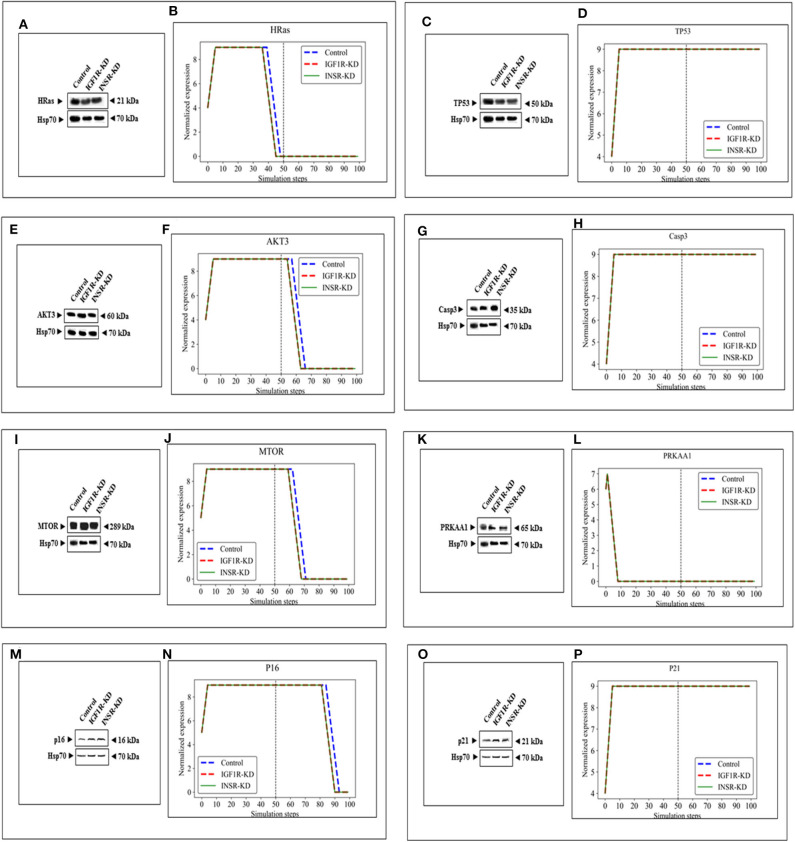
Figure 4.
Eight selected genes that do not change between control and KDs: BioNSi simulations validated by Western blots. Western blot analyses showing expression of HRas (A), TP53 (C), AKT3 (E), CASP3 (G), MTOR (I), PRKAA1 (K), p16 (M), and p21 (O) proteins were conducted on whole cell lysates of Control, IGF1R-KD, and INSR-KD cells. Hsp70 was used as a loading control. Data are representative of two independent experiments. (B,D,F,H,J,L,N,P) BioNSi plots of normalized expression values against 100 simulation steps in Control (blue), IGF1R-KD (red), and INSR-KD (green) cells. A dashed vertical line indicates 50 steps of simulation. Splicing has occurred in the blot figures and full scans of the entire original (unprocessed) gels are presented in Supplementary Material. Squares in the uncropped films denote bands shown in the final figures.

