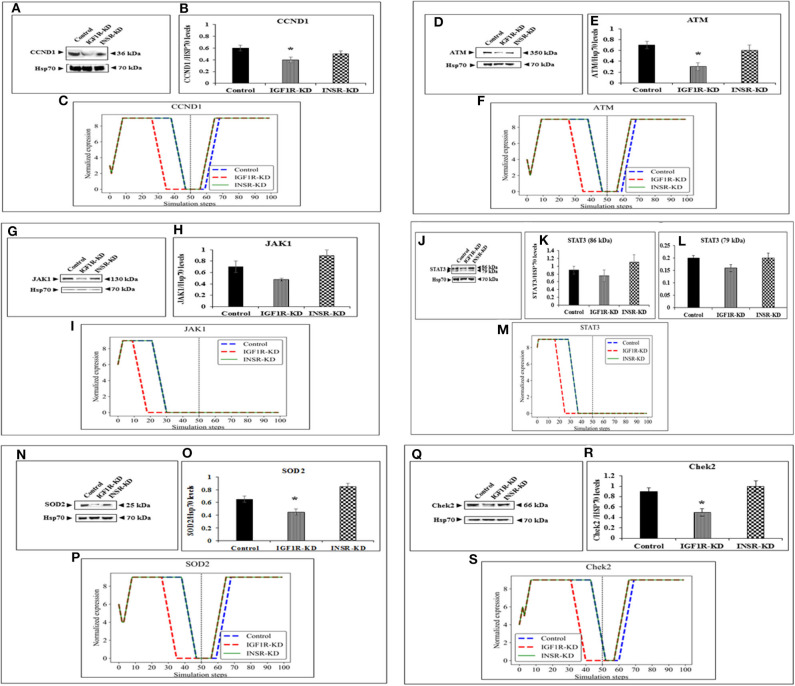
Figure 5.
Six selected genes exhibiting a change between control and IGF1R-KD, validated by Western blots. Western blot analysis showing expression of CCND1 (A), ATM (D), JAK1 (G), STAT3 (J), SOD2 (N), and Chek2 (Q) proteins levels were performed as described above. (B,E,H,K,L,O,R) Scanning densitometry analysis of basal proteins levels. Bars represent protein values (AU, arbitrary units), normalized to the corresponding Hsp70 levels. Results of an illustrative experiment, repeated twice with similar results, are shown. *p < 0.01 vs. control cells. (C,F,I,M,P,S) BioNSi simulation plots of normalized expression values against 100 simulation steps are shown. Control (blue), IGF1R-KD (red), and INSR-KD (green). A dashed vertical line indicates 50 steps of simulation. Splicing has occurred in the blot figures and full scans of the entire original (unprocessed) gels are presented in Supplementary Material. Squares in the uncropped films denote bands shown in the final figures.

