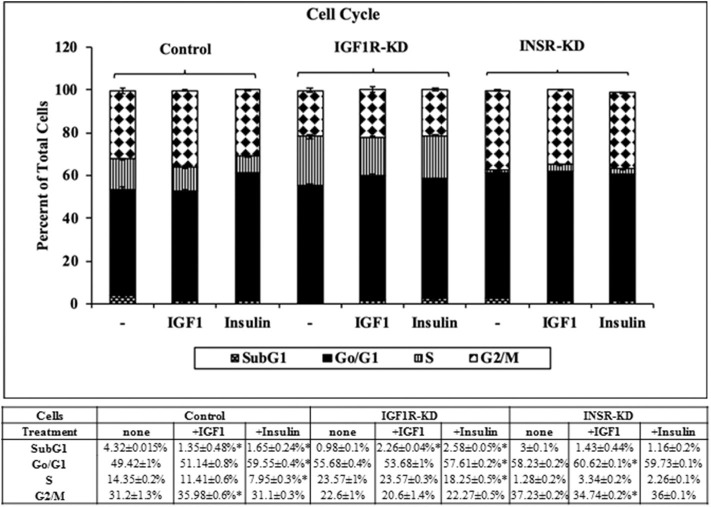
Figure 6.
Cell cycle stages distribution in Control, IGF1R-KD, and INSR-KD cells. Cells were seeded in quadruplicate dishes, and treated with IGF1 or insulin (or left untreated, controls) for 72 h. The bars represent mean ± SEM) of three independent experiments, performed each in duplicates samples. Cell cycle distribution was measured as described in section Materials and Methods. *p = 0.05 vs. untreated cells.

