Figure 7.
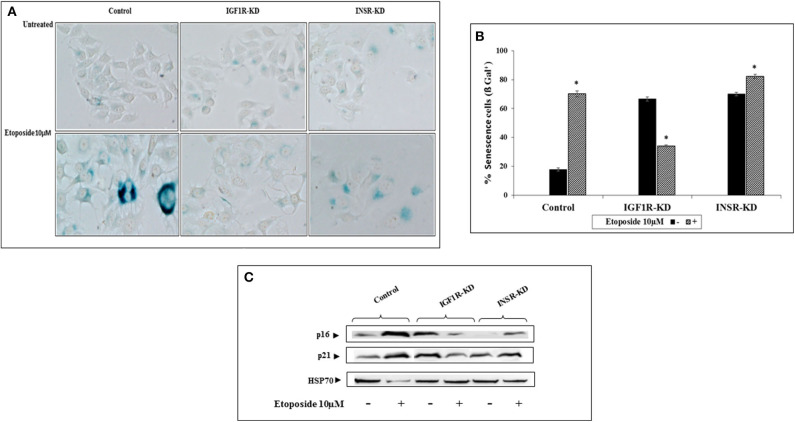
Effect of INSR or IGF1R disruption (KD) on etoposide-induced senescence. (A) Senescence-associated beta-galactosidase (SA-β-gal) staining (blue/green) in MCF7 stable cells after treatment with etoposide (10 μM) for 48 h. (B) Percentage of SA-β-gal positive cells was counted in at least three random fields from quadruplicates samples. Graph represents means ± SEM (n = 4). *Statistically significantly different from controls, p < 0.01. (C) Western blotting of p16 and p21 protein expression in the presence (+) or absence (–) of etoposide in MCF7 stable cells. Hsp70 was used as a loading control. Splicing has occurred in the blot figures and full scans of the entire original gels is presented in Supplementary Material. Squares denote bands shown in the final figures.

