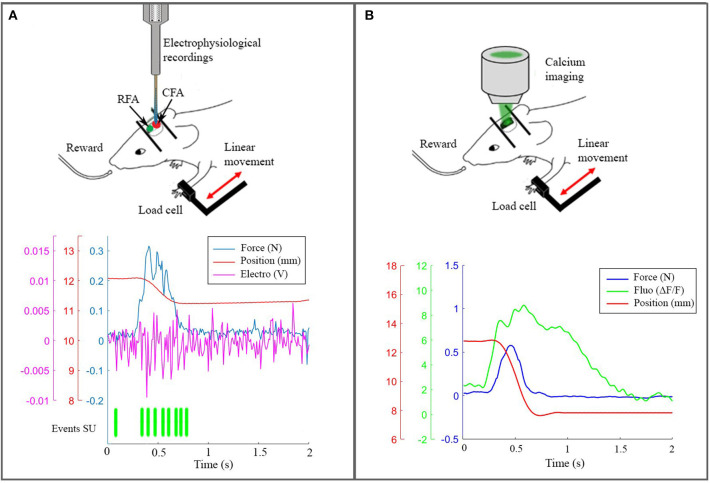
Figure 3.
The real robotic platform. (A) On the top a schematic representation of the experiment during electrophysiological recording in CFA. At the bottom the synchronized data: force peak (blue), movement of the slide (red), high frequency electrophysiological signal of a single channel (magenta) and the timestamp of a selected single unit. (B) On the top a scheme of the experiment with the setup to record calcium activity. At the bottom the recorded data after synchronization: force peak (blue), movement of the slide (red) and calcium response (green).

