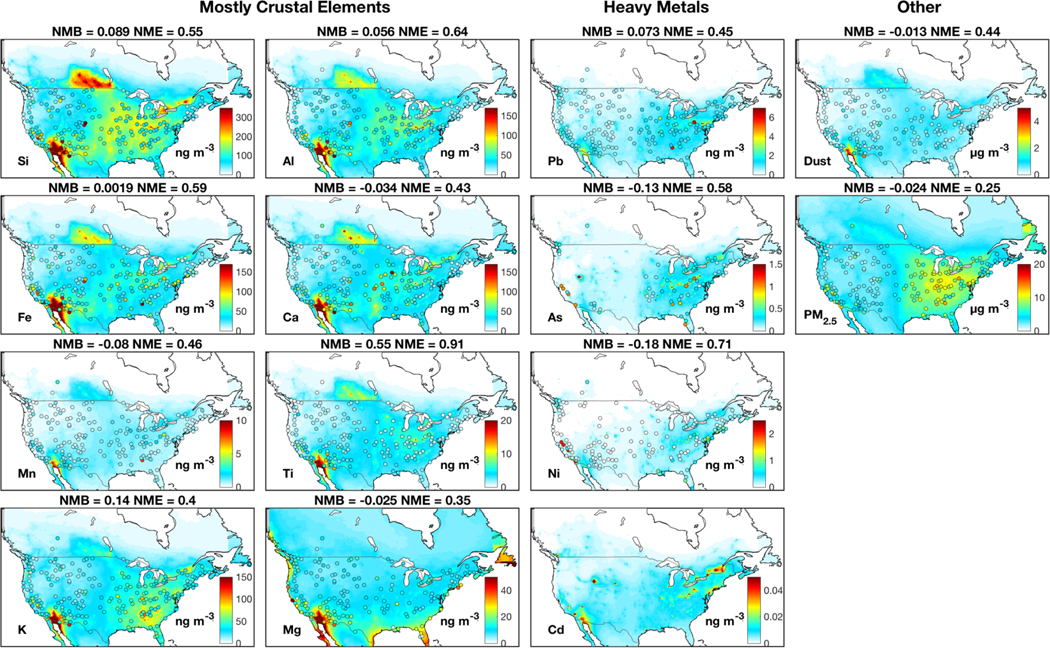
Figure 1:
Annual median trace metal, fine dust and PM2.5 concentrations over North America. Filled circles are median observations from the IMPROVE, the CSN and the NAPS networks for 2011–2015. Observations of Cd are excluded because more than 70% of its measurements from every site are below the minimum detection limit (1 ng m−3). Background colors are concentrations for 2013 from our standard simulation at 0.25° x 0.31° resolution. Dust includes natural and anthropogenic windblown mineral dust. Anthropogenic dust is also included in PM2.5. Statistics are normalized mean bias (NMB) and normalized mean error (NME).

