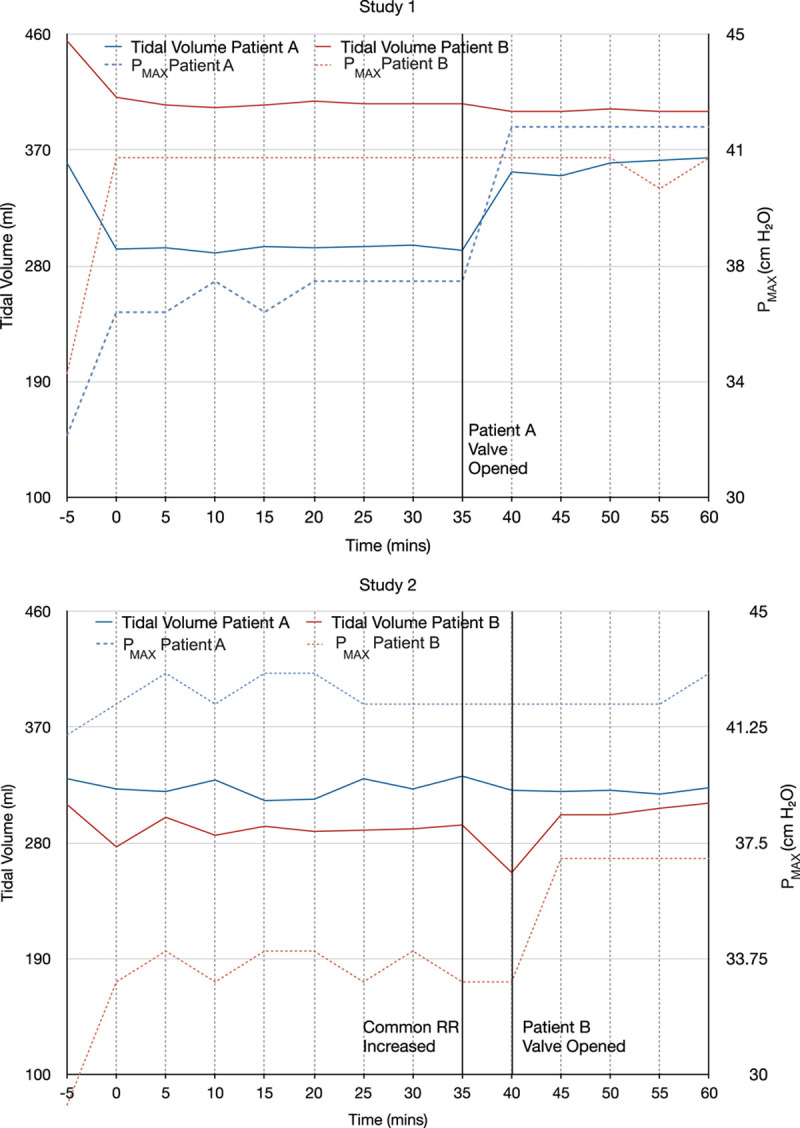
Fig. 5.

Tidal volumes and peak airway pressures (Pmax) during human studies. Tidal volumes are shown in solid lines, and peak inspiratory pressures are shown in dashed lines. Top panel: Study 1. At the start of the study, tidal volumes fell for both patients, and Pmax rose. Both parameters then stabilized. The black line indicates when the flow control valve for Patient A was further opened by three fourths of a turn. The tidal volume and Pmax for Patient A subsequently rose, while the tidal volume and Pmax for Patient B remained unchanged. Bottom panel: Study 2. Tidal volume fell and Pmax initially rose, as in study 1. At 35 min, the common respiratory rate (RR) was increased, and tidal volumes fell for both patients, but more so for Patient B. The black line at 40 min indicates when the flow control valve for Patient B was opened to allow more flow. Tidal volume for Patient B recovered and the Pmax rose.
