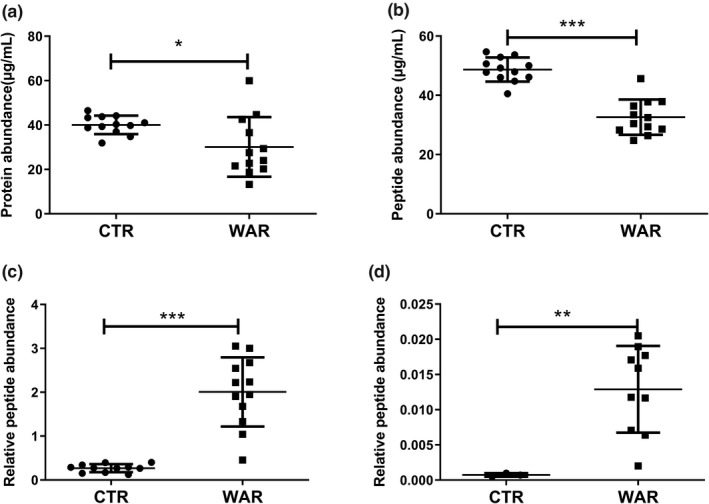
Figure 4.

Comparison of abundance of total prothrombin, carboxy peptide (ANTFL[E][E]VRK) and des‐carboxy peptides (ANTFLEEVRK and GLNER) in serum samples from control and warfarin treated individuals. Each dot and square represent the individual subjects from control, and warfarin treated groups, respectively. Error bars indicate the standard deviation. Significant reduction in the levels of total prothrombin (P = 0.02) and carboxylated prothrombin (P < 0.0001) in warfarin treated subjects compared with control subjects was observed. Des‐carboxylated prothrombin was significantly (P < 0.0001) elevated in warfarin treated subjects. Des‐carboxy peptide ANTFLEEVRK is a low response peptide, which was quantifiable in first analysis only (n = 1). Mann‐Whitney test. *P value < 0.05, **P value < 0.01 and ***P value < 0.001.
