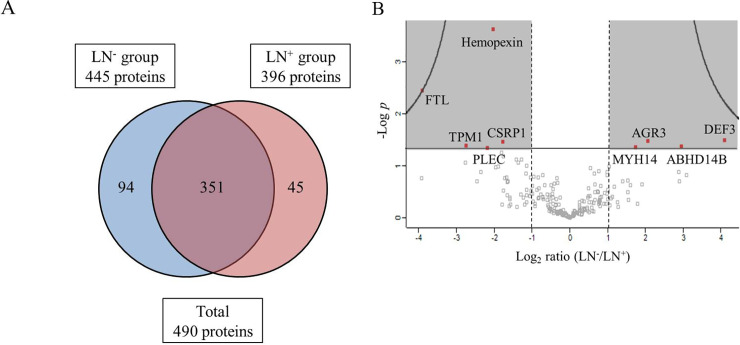
Fig 3. Proteomics analysis by LC-MS/MS using the PDAC stroma.
(A) Venn diagram of proteins detected in LN− and LN+ groups by using LC-MS/MS analysis; 490 proteins were detected in total, 351 of which were present in both groups. (B) Volcano plot of detected proteins (imported from Perseus software). Vertical axis: level of significance; horizontal axis: logarithm of the ratio of the amounts of each protein detected in LN− or LN+ groups. Red plots in shaded area, satisfying log2 ratio of >1 or <1 and also showing statistical significance (p < 0.05, Student’s t-test), are proteins exhibiting significantly different abundances between the two groups. In total, nine proteins were selected as candidate proteins.

