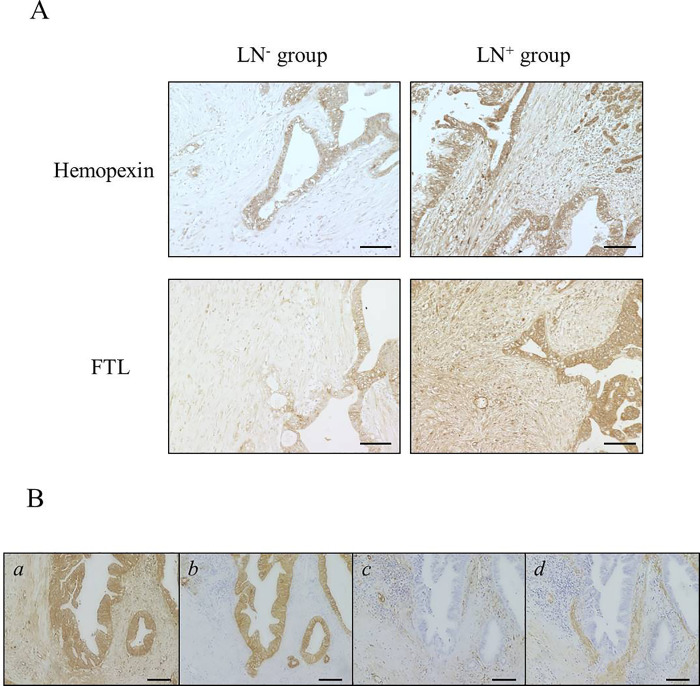
Fig 4. Immunohistochemistry of hemopexin and ferritin light chain (FTL).
(A) Representative images of immunohistochemistry of hemopexin and FTL in LN− and LN+ groups. Magnification: 100×. Scale bar: 100 μm. (B) Representative images of marker staining for localization diagnosis by using serial sections of LN+ group samples. a: Immunostained section of hemopexin-positive sample. b–d: Sections immunostained for marker of each component (b: cytokeratin; c: vimentin; d: αSMA).

