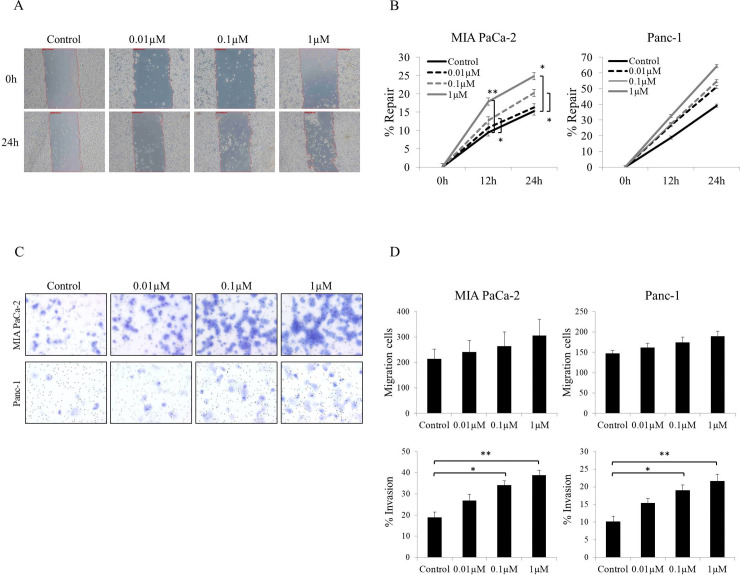
Fig 5. Wound-healing, cell-migration, and cell-invasion assays.
(A) Representative micrographs of MIA PaCa-2 cells at 0 or 24 h after wounding. Cells were cultured in 0.5% FBS/RPMI alone or medium including 0.01–1 μM hemopexin. Magnification: 50×. (B) Wound-repair rate (%Repair) of MIA PaCa-2 and Panc-1 cells; in both cell lines, %Repair increased with an increase in hemopexin concentration at 12 or 24 h. In MIA PaCa-2 cells, %Repair at 0.1 or 1 μM hemopexin was significantly increased relative to control at 12 or 24 h. (C, D) Migration and invasion assays performed using Transwell®. (C) Representative micrographs of invading cells. Upper images: MIA PaCa-2 cells; lower panels: Panc-1 cells. With both cell lines, invading cells increased with an increase in hemopexin concentration. Magnification: 200×. (D) Number of migrating cells and percentage of invading cells (%Invasion). In both cell lines, the number of migrating cells increased slightly as the hemopexin concentration was increased, but the change was not statistically significant. %Invasion also increased with an increase in hemopexin concentration; 0.1 and 1 μM hemopexin significantly promoted cell invasion as compared to control treatment in both cell lines. %Invasion = (mean number of cells invading through Matrigel® insert membrane/mean number of cells migrating through control insert membrane) × 100. Cells were counted in eight random fields (200×) and the mean number was calculated. Each experiment was conducted in triplicate. **p < 0.01, *p < 0.05.

