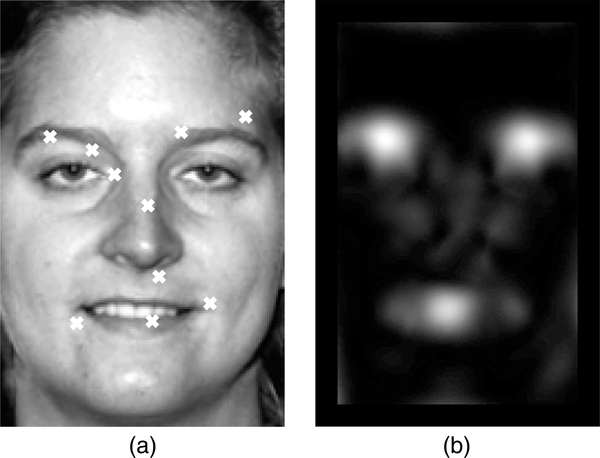
Figure 1.
(a) An image from the FERET database with 10 sample fixation points. (b) The corresponding salience map generated using the technique of Yamada and Cottrell (1995). The fixations shown in (a) were chosen randomly according to this salience map, and while they tend to cluster around highly salient areas, inhibition of return enforces a more even distribution of fixations across the image.

