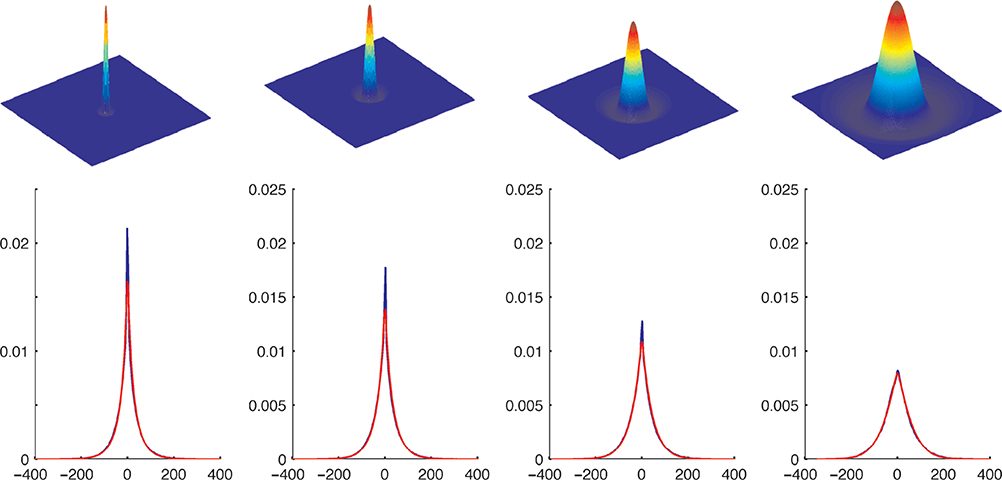
Figure 1.
Four scales of difference of Gaussians (DoG) filters were applied to each channel of a set of 138 images of natural scenes. Top: The four scales of difference of Gaussians (DoG) filters that were applied to each channel. Bottom: The graphs show the probability distribution of filter responses for these four filters (with σ increasing from left to right) on the intensity (I) channel collected from the set of natural images (blue line), and the fitted generalized Gaussian distributions (red line). Aside from the natural statistics in this training set being slightly sparser (the blue peak over 0 is slightly higher than the red peak of the fitted function), the generalized Gaussian distributions provide an excellent fit.

