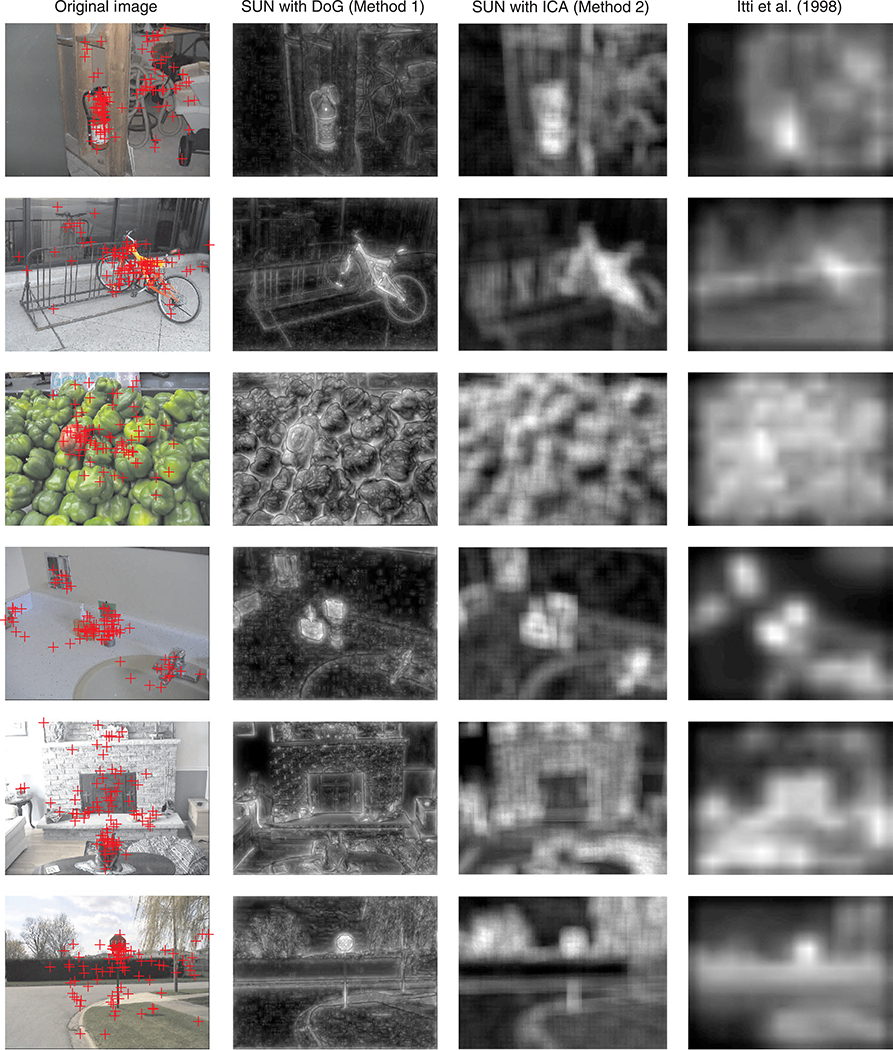
Figure 3.
Examples of saliency maps for qualitative comparison. Each row contains, from left to right: An original test image with human fixations (from Bruce & Tsotsos, 2006) shown as red crosses; the saliency map produced by our SUN algorithm with DoG filters (Method 1); the saliency map produced by SUN with ICA features (Method 2); and the maps from (Itti et al., 1998, as reported in Bruce & Tsotsos, 2006) as a comparison.

