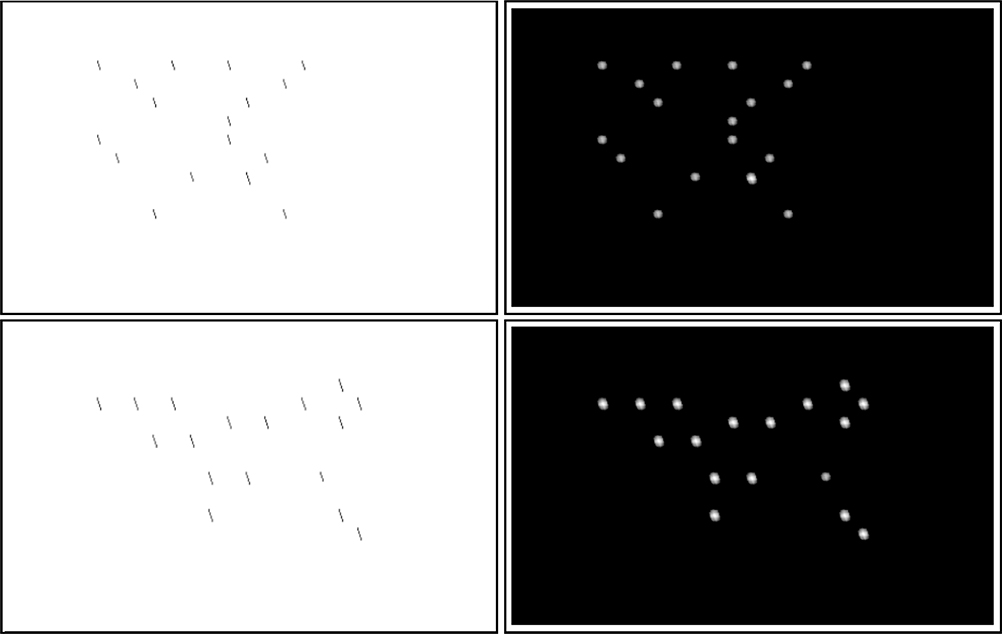
Figure 8.
Illustration of a visual search asymmetry with line segments of two different lengths (Treisman & Gormican, 1988). Shown are the original image (left) and the corresponding saliency map (right) computed using SUN with ICA features (Method 2). Top row: a long bar is easy to locate in a sea of short bars. Bottom row: a short bar in a sea of long bars is harder to find. This corresponds with the predictions from SUN’s saliency map, as the longer bars have higher saliency.

