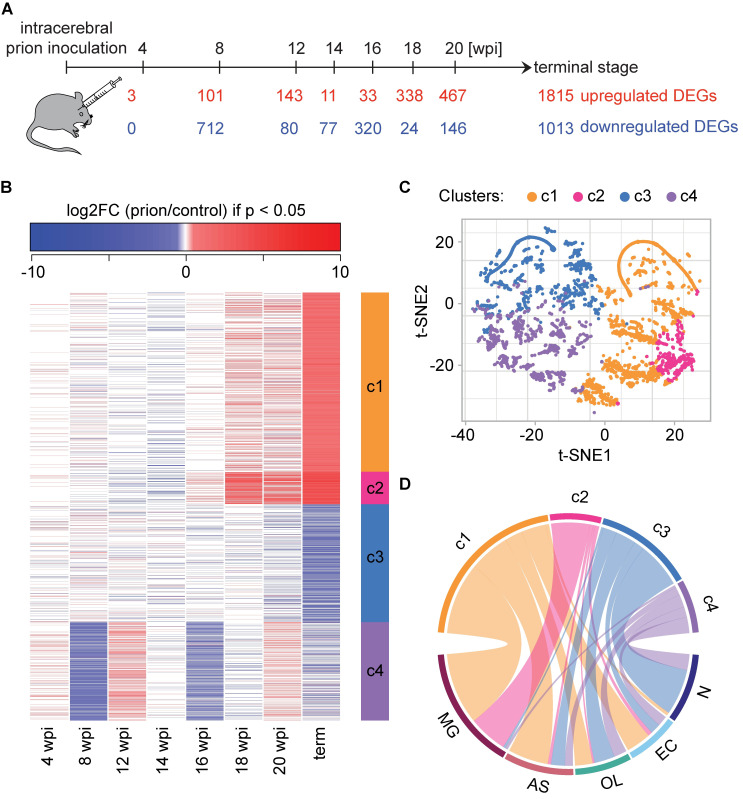
Fig 1. Identification of differentially expressed genes (DEGs) during prion disease progression.
A Timeline of prion inoculations. Numbers of upregulated and downregulated DEGs (|log2FC| > 0.5 and FDR < 0.05) are indicated. Several DEGs were up- and downregulated at different time points. B Heatmap displaying the log2FC of 3,723 genes that are differentially expressed (|log2FC| > 0.5 and FDR < 0.05) at least at one time point. Only log2FC values with p < 0.05 are colored. Unsupervised kmeans clustering (k = 4 clusters) identified four coherent patterns (c1-c4) of log2FC oscillations over time (right side bar). C t-distributed stochastic neighbor embedding (t-SNE) plot (n components = 2, perplexity = 50) visualizing the separation of DEGs into four clusters. D Circos plot summarizing the cell type-enriched genes within each cluster. Clusters are identified by the same colors in panels b-d.

