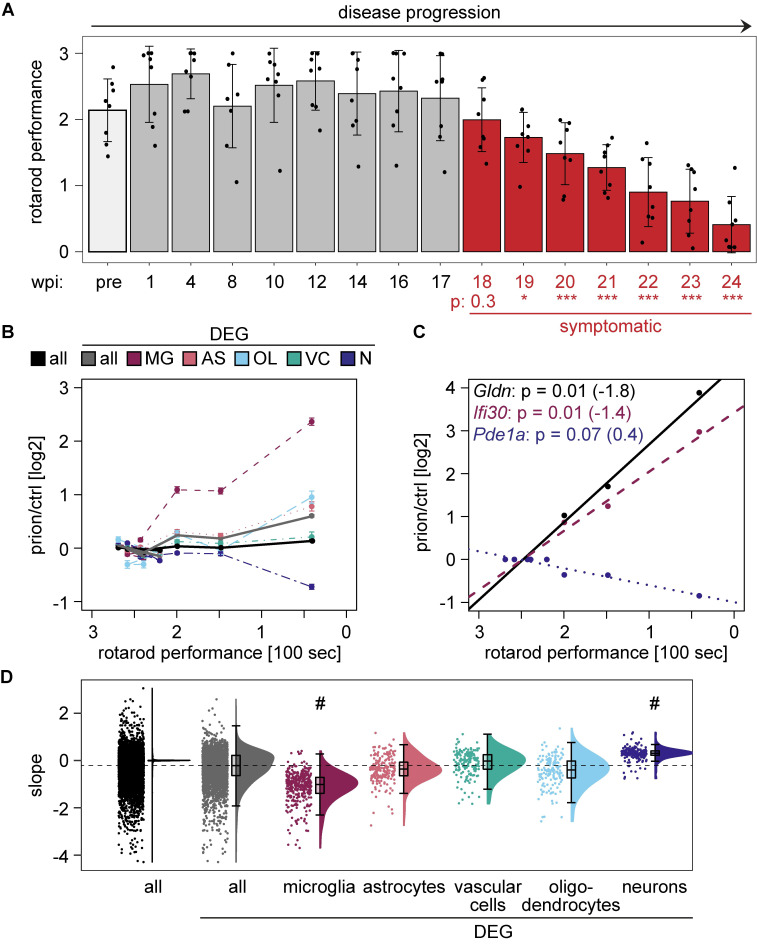
Fig 3. Microglia activation and prion disease progression.
A Rotarod performance of prion-inoculated mice during disease progression (pre = pre-inoculation). Bars represent the mean latency to fall in 100 seconds. Each dot represents one individual mouse. P-adjusted: P values were calculated with a one-way ANOVA followed by Tukey’s multiple comparison test (*p<0.05; ***p<0.001; compared to 1 wpi). Red: symptomatic phase of disease. Error bars: standard deviation. B Comparison of rotarod performance (latency to fall in 100 seconds) and average log2FC at the corresponding time point. Lines represent all genes, all DEGs or DEGs that are enriched in the indicated cell type. Error bars: standard error of the means (SEM). C Linear regression analysis between the rotarod performance and the gene expression changes of individual genes. Shown are the most significantly correlating genes that were non-enriched (black), microglia-enriched (red-violet) and neuronal-enriched (violet-blue). Corresponding Bonferroni-corrected p values and slopes of the linear regression analysis are indicated in brackets. D Raincloud plot displaying the slope distribution of the linear regression analysis. The slope between all DEGs and DEGs that are either microglia- or neuron-enriched differs significantly (p < 1*10−14; one-way ANOVA followed by Tukey’s multiple comparison test).

