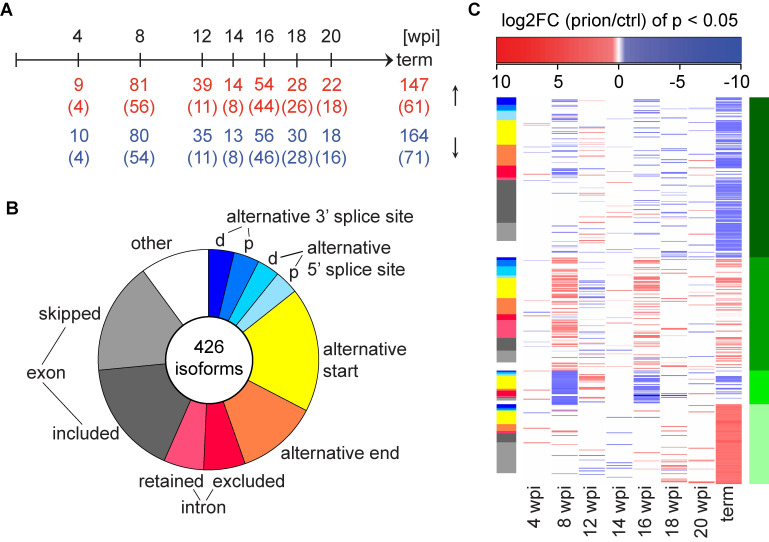
Fig 4. Post-transcriptional regulation during prion disease progression.
A Time points of prion inoculations and differentially expressed splice isoforms (FDR < 0.05 at least at one time point). The number of upregulated and downregulated isoforms (p < 0.05) at each time point and the numbers of shared genes (in brackets) are indicated. B Pie chart representing splicing event percentages of 426 differentially expressed isoforms (FDR < 0.05 at least at one time point). d = distal, p = proximal. C Heat map depicting the log2FC of differentially expressed isoforms (only log2FC with p < 0.05 are colored). The corresponding splicing event (same coloring as in B) is indicated as a side bar on the left. Unsupervised kmeans clustering (k = 4 clusters) identified coherent patterns of log2FC. Clusters c1-4 are indicated as a side bar on the right.

