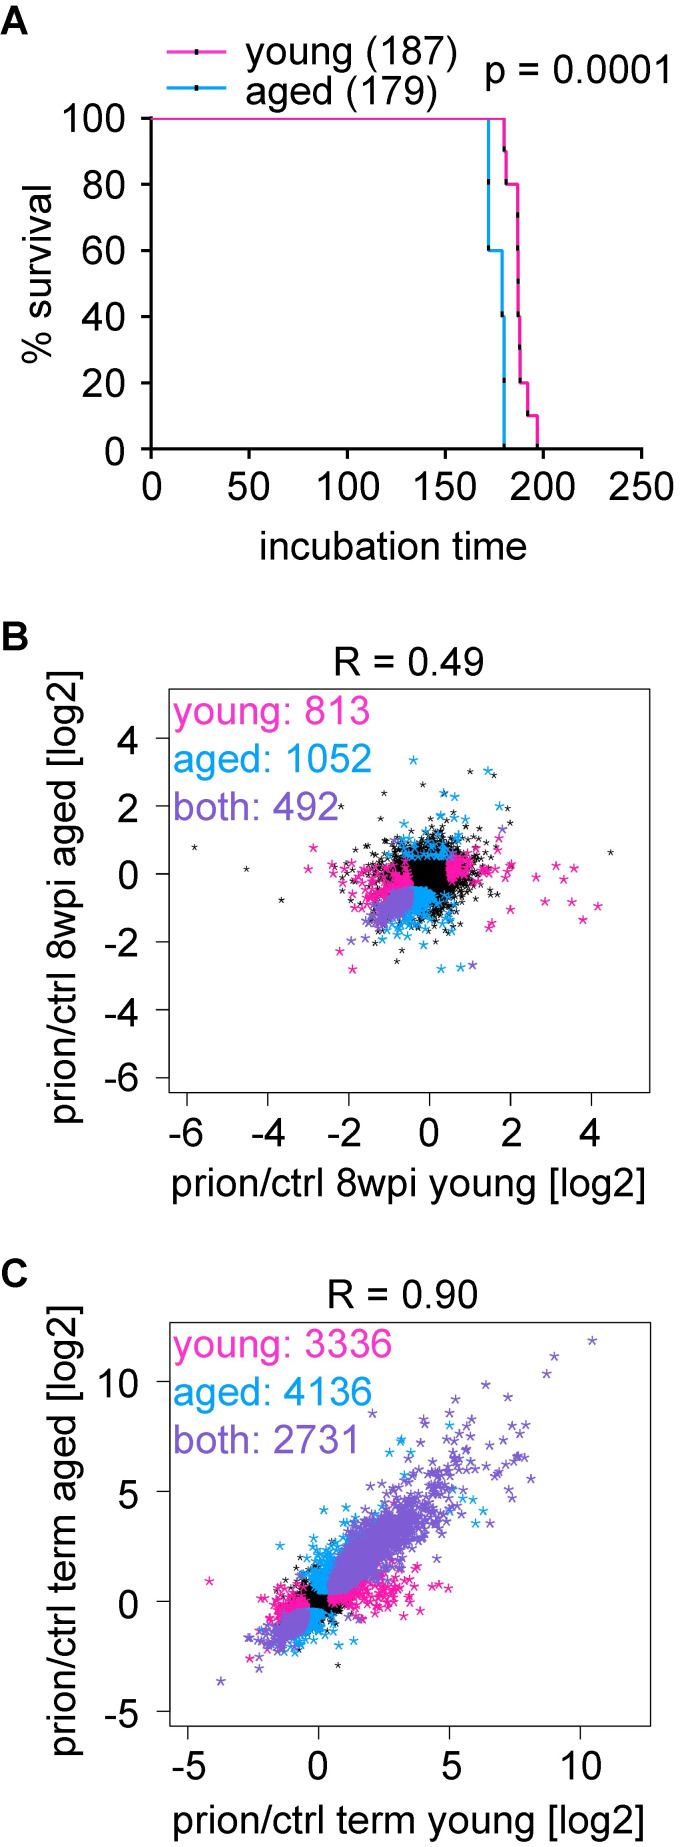
Fig 5. Impact of aging on prion disease progression.
A Survival curves of mice inoculated at 2 months (young) or one year (aged). Shown is the % survival compared to days post inoculation (dpi). The median survival, which is significantly reduced in aged mice (p = 0.0001; log-rank Mantel-Cox test) is indicated. B Scatter plot comparing the log2FC of expressed genes in young and aged prion-inoculated mice at 8 wpi. Genes that are differentially expressed (|log2FC| > 0.5 and FDR < 0.05) in young (n = 813) or aged (n = 1,052) mice are colored in pink and blue, respectively. The change in expression correlates (R = 0.39) and 492 genes change both in young and aged mice (colored in purple). C Scatter plot comparing the log2FC of expressed genes in young and aged prion-inoculated mice at the terminal stage. Genes that are differentially expressed (|log2FC| > 0.5 and FDR < 0.05) in young (n = 3,336) or aged (n = 4,136) mice are colored in pink and blue, respectively. The change in expression is highly correlated (R = 0.89) and 2,731 genes change both in young and aged mice (colored in purple).

