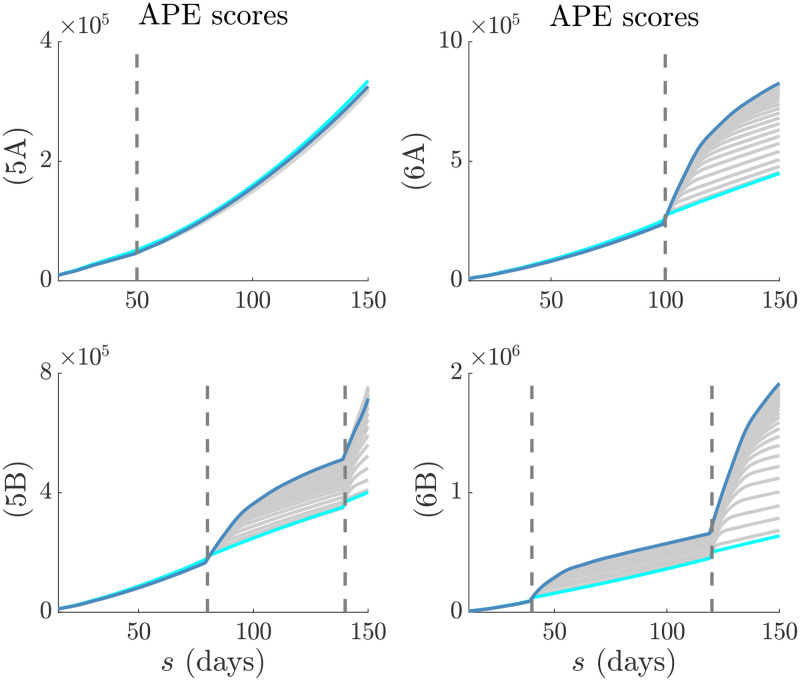
Fig 7. APE scores in real time.
The successive (in time) APE scores for each window length, k, are shown in grey. The scores for the smallest and largest k are in cyan and magenta respectively. Graphs correspond to the models in Figs 5 and 6. Dashed lines are the change-times of each model. In (5A) the change-time does not significantly affect the epi-curve shape and so the APE scores are close together. In (5B), (6A) and (6B) the change-times notably alter the epi-curve shape so that the choice of k becomes critical to performance.

