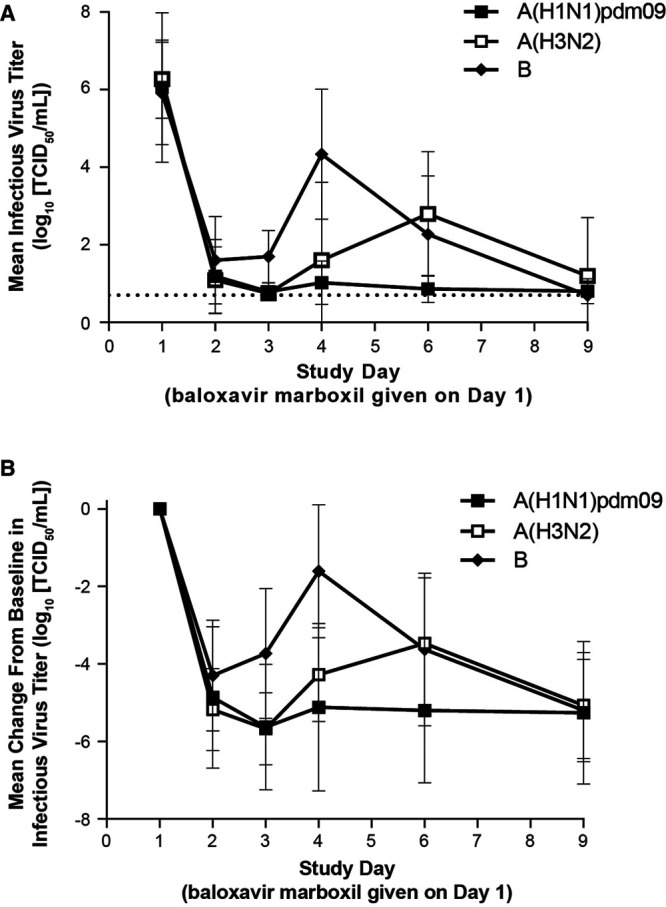
FIGURE 2.

(A) Mean infectious virus titer and (B) change from baseline in mean infectious virus titer by virus type/subtype. Data are presented as mean ± SD. The dotted line in panel A indicates the lower limit of detection (0.7 log10 TCID50). The subset of children who were positive for influenza virus titer at baseline was included in this analysis. Child numbers for A(H1N1)pdm09, A(H3N2) and B, respectively, were: n = 10, 9 and 12 on day 1, day 2, day 6 and day 9; n = 7, 6 and 4 on day 3; and n = 5, 5 and 9 on day 4. TCID50 indicates 50% tissue culture infective dose.
