
Figure 2.
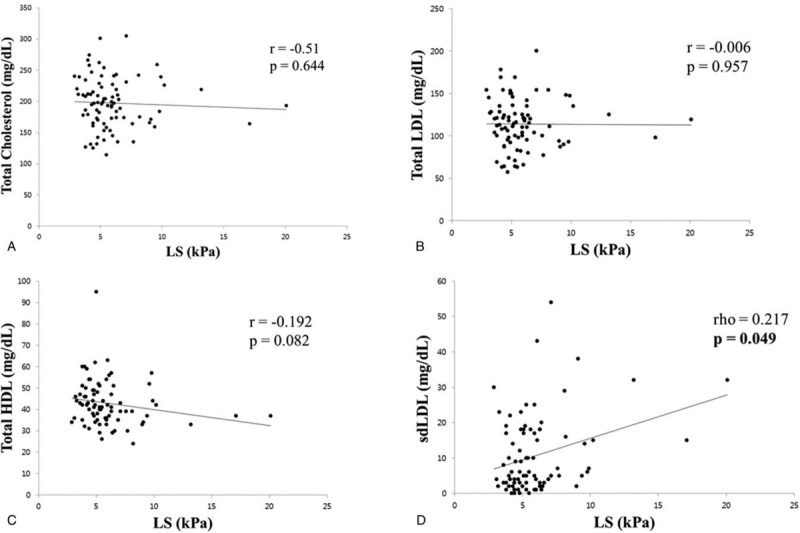
Correlation between lipid profile and LS. (A) Correlation between total cholesterol and LS. (B) Correlation between total LDL and LS. (C) Correlation between total HDL and LS. (D) Correlation between sdLDL and LS. HDL = high density lipoprotein, LDL = low density lipoprotein, LS = liver stiffness, sdLDL = small dense low density lipoprotein.