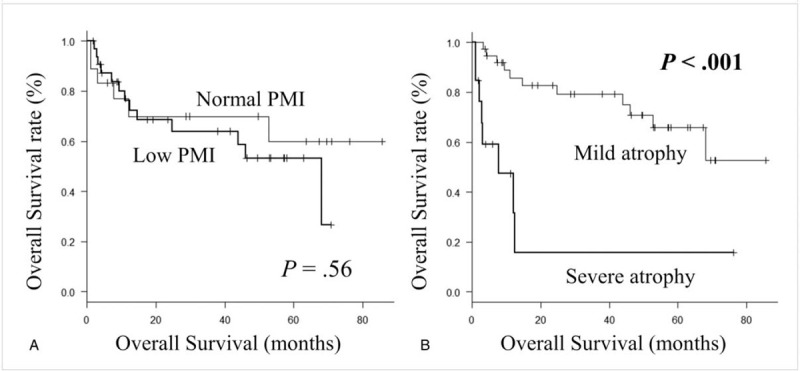
Figure 3.

A. Kaplan-Meier curve for overall survival between the patients with normal psoas muscle index (PMI) (≥ 6.0 cm2/m2 for men and ≥ 3.4 cm2/m2 for women) and low PMI (< 6.0 cm2/m2 for men and < 3.4 cm2/m2 for women). B. Kaplan-Meier curve for overall survival between patients with mild (ΔPMI/month above the lower quartile) and severe atrophy (ΔPMI/month below the lower quartile) group.
