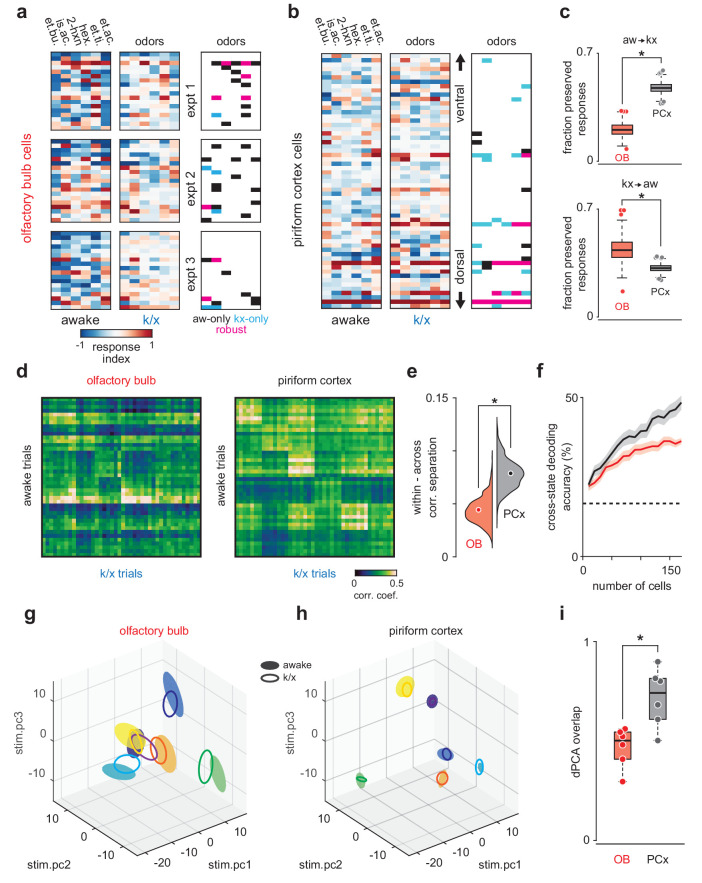
Figure 2. PCx stabilizes odor representations across activity regimes.
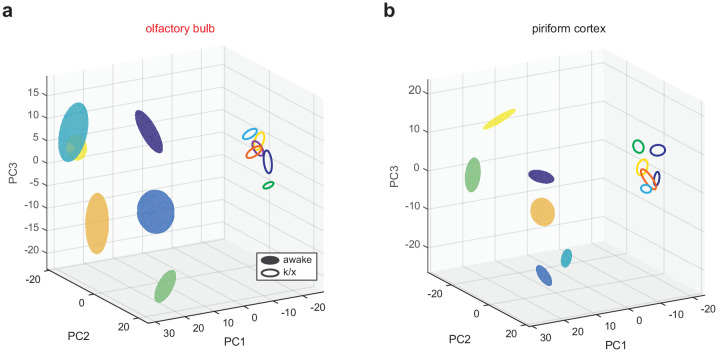
(a–b) Example population responses to six odors for three OB (a) and one PCx recordings (b). The response index indicates the reliability of the difference between pre-odor and odor-evoked spiking (i.e. auROC*2–1). Awake-only (black), k/x-only (cyan), and robust cell-odor pairs (magenta), which were activated in both states ('activated' = p<0.05 rank-sum test), are indicated at right. PCx cells are sorted by their dorsal-ventral location. Note more robust PCx responses in deeper, (i.e. more dorsal) layer II. (c) Top, the fraction of significant awake cell-odor pair responses that are preserved under anesthesia in OB (n = 187 cells, 12 experiments) and PCx (n = 640 cells, 11 experiments). Bottom, the fraction of significant cell-odor pair responses under anesthesia that are observed in awake condition. Asterisks indicate p<0.05 on bootstrap difference test (aw to k/x: p<0.001; k/x to aw: p=0.023). (d) Cross-state trial-by-trial pseudopopulation correlation matrices sorted by odor within OB and PCx illustrate the similarity between awake and anesthetized population responses. The horizontal bands in these matrices indicate awake trials that had consistently high (light bands) or consistently low correlations (dark bands) with k/x responses regardless of odor. Typically, dark bands occur on awake trials with higher firing rates. Note that for these analyses, we used trials 6–13, and the regularity of these bands, especially in OB, reflects the progressive adaptation of responses, which are described in detail in Figure 6e. Separation (mean within-odor correlations - mean across-odor correlations) of cross-state odor representations in OB and PCx over 1000 bootstrap iterations. Asterisks indicate p<0.05 in bootstrap difference test (OB vs PCx, p<0.001). Means are shown as filled circles. (f) Cross-state decoding accuracy (trained on awake trials, tested on k/x trials) in OB and PCx. Mean ± 95% bootstrapped confidence intervals. (g) OB pseudopopulation activity projected onto the first three stimulus-dependent demixed PCA components and shown as mean ± 1 s.d. ellipsoids across trials of the same odor. Different colors correspond to different odors. Filled ellipsoids are awake responses, unfilled ellipsoids are anesthetized responses. (h) As in g, but for PCx. Note both the overall larger separation between odors in either state and the greater overlap of same-odor responses across states. (i) Overlap between awake and k/x trial response distributions projected onto their first three stimulus-dependent components in OB (red) and PCx (black). Dots show overlap scores for individual odors. Overlap is calculated using Matusita’s overlap measure (see Materials and methods). Unpaired t-test, n = 6 odors, t(10) = −3.41, p=0.007.


