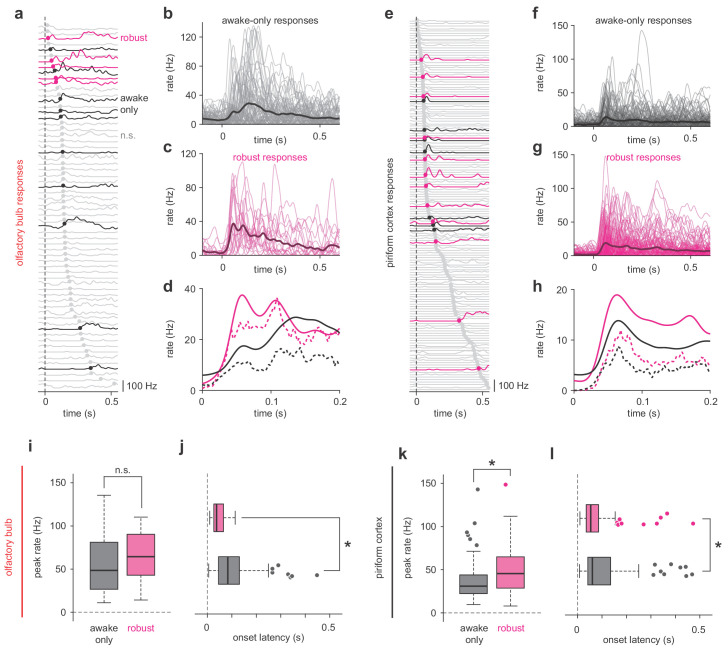
Figure 3. Robust PCx representations derive from short-latency OB responses.
(a,e) All cell-odor pair responses for example simultaneously recorded OB (a) and PCx (e) populations sorted by onset latency determined by 2.5 st. dev. threshold crossing. Latencies are marked with filled circles. Robust, awake-only, and non-significant responses are magenta, black, and gray, respectively. (b–c) Overlay plots of all OB awake-only responses (b) or robust responses (c). The bold line is the mean response. (d) Mean (solid line) and median (dashed line) awake-only (black) and robust (magenta) OB responses. (f–h) As in b-d, but for PCx. (i–j) Peak firing rates (i) and onset latencies (j) for robust vs awake-only responses in OB. Boxes indicate quartiles and whiskers indicate ± 2.7 st. dev. from mean. Data points outside this range are shown as circles. Asterisks indicate p<0.05 in unpaired t-test. n = 81 awake-only OB cell-odor pairs and 21 robust OB cell-odor pairs. Peak: t(100) = −0.82, p=0.42; Latency: t(100) = 3.06, p=0.003. (k–l) As in i-j but for PCx. n = 125 awake-only PCx cells and 116 robust PCx cells. Peak: t(239) = −4.49, p=1.12e-5; Latency: t(236) = 2.47, p=0.01.

