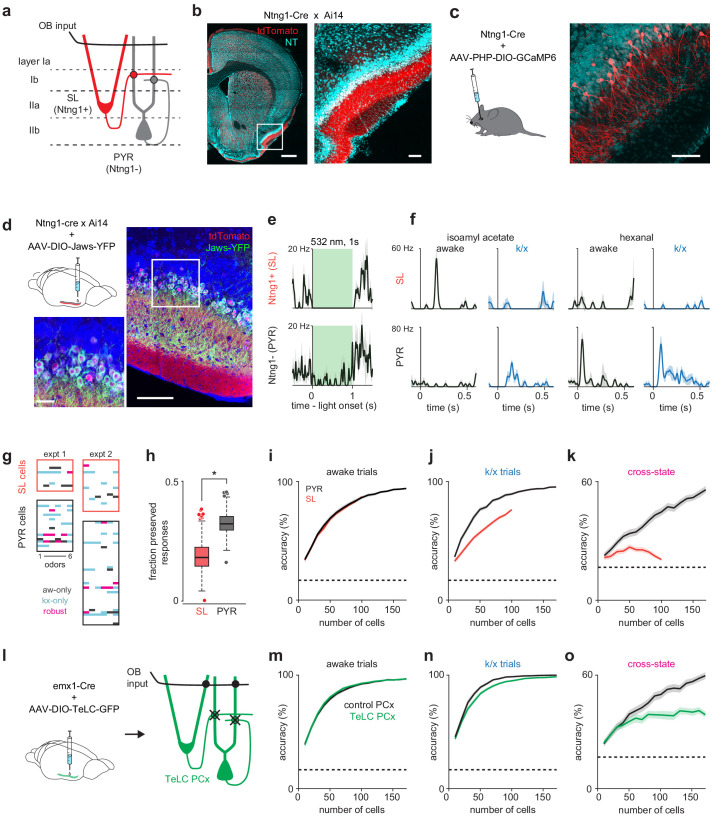
Figure 4. Pattern recovery requires recurrent circuits.
(a) Schematic of inputs to excitatory cell-types in PCx. Semilunar cells only receive OB input; pyramidal cells receive OB and recurrent collateral inputs. (b–c) Selective expression in PCx semilunar cells using the Ntng1-Cre driver line. (b) Strong expression of Cre-dependent tdTomato in PCx layer IIa of Ntng1-Cre X Ai14 mice. Scale bars: 500 μm and 100 μm. (c) Sparse Cre-dependent GCaMP6 expression shows Ntng1+ cells restricted to superficial layer II (i.e. layer IIa) and lacking basal dendrites. Scale bar: 100 μm. (d) Identifying Ntng1+ (semilunar, SL) and Ntng1- (pyramidal, PYR) cells in vivo using optogenetic inhibition. Injection of AAV expressing Cre-dependent Jaws in anterior piriform cortex restricts expression to cells with semilunar localization and morphologies. Scale bars: 100 μm and 20 μm. (e) Simultaneously recorded example cells exhibiting unambiguous suppression (top) or residual spiking (bottom) in response to 1 s, 532 nm light pulses. Traces show mean ± SEM responses over 40 laser pulses. Optogenetic tagging and unit stability criteria identified 108 SL and 234 PYR cells in 12 experiments from seven mice. (f) Odor responses during awake and k/x trials for example SL (top) and PYR cells (bottom). (g) State-specific (black, awake-only; cyan k/x only) and robust (magenta) responses in simultaneously recorded populations of SL and PYR cells from two example experiments. (h) The fraction of significant awake cell-odor pair responses that are preserved under anesthesia in SL and PYR. Asterisk indicates p<0.05 on bootstrap difference test (p=0.036). (i–j) Odor classification accuracy as a function of pseudopopulation size using SL (red) and PYR (black) cells in awake (i) and anesthetized (j) states. Mean ± 95% bootstrapped confidence intervals. (k) Cross-state decoding accuracy using SL (red) and PYR (black) cells. Mean ± 95% bootstrapped confidence intervals. (l) Strategy for disabling recurrent circuits in PCx. Expression of tetanus toxin in all PCx excitatory cells disrupts recurrent connectivity. (m–n) Odor classification accuracy as a function of pseudopopulation size in TeLC-infected (green) and contralateral control (black) PCx in awake (m) and anesthetized (n) states. Mean ± 95% bootstrapped confidence intervals. Pseudopopulations were built from 241 cells recorded in the control hemisphere in 4 experiments with 4 mice and 214 cells from the TeLC hemisphere in 6 experiments with five mice. (o) Cross-state decoding accuracy in TeLC- (green) and control (black) PCx. Mean ±95% bootstrapped confidence intervals.
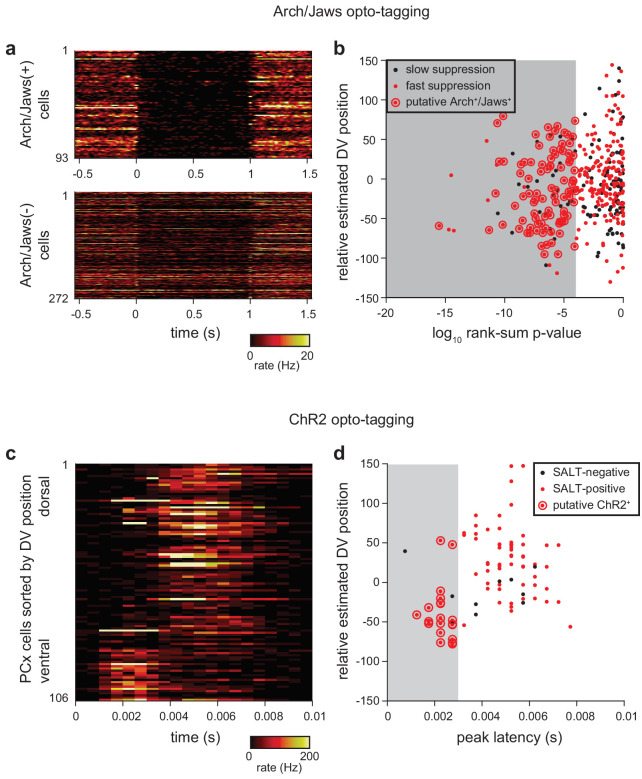
Figure 4—figure supplement 1. Criteria for identifying opto-tagged Ntng1+ cells.
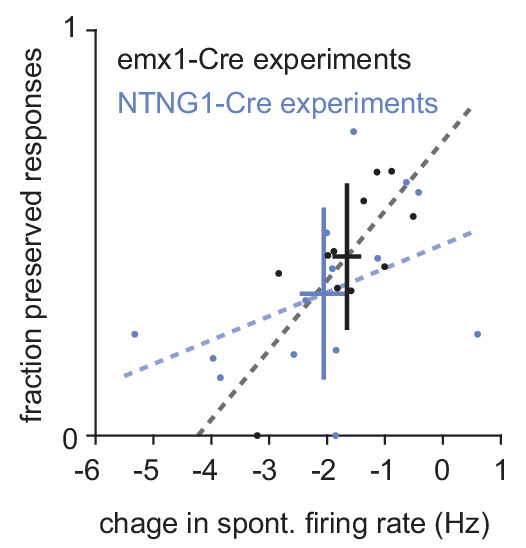
Figure 4—figure supplement 2. Across-experiment variability in response preservation depends on preserved spontaneous activity.

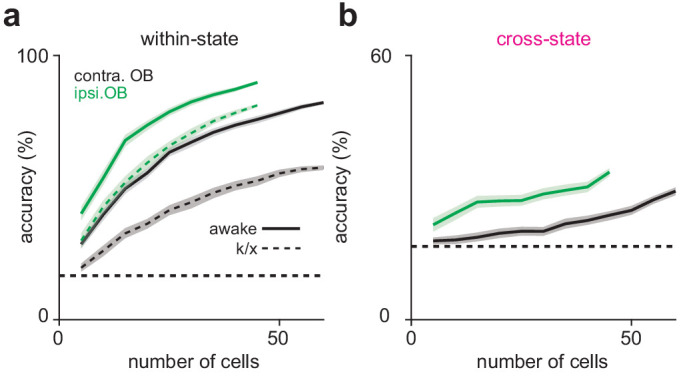
Figure 4—figure supplement 3. Decoding from TeLC-ipsilateral and contralateral OB populations.


