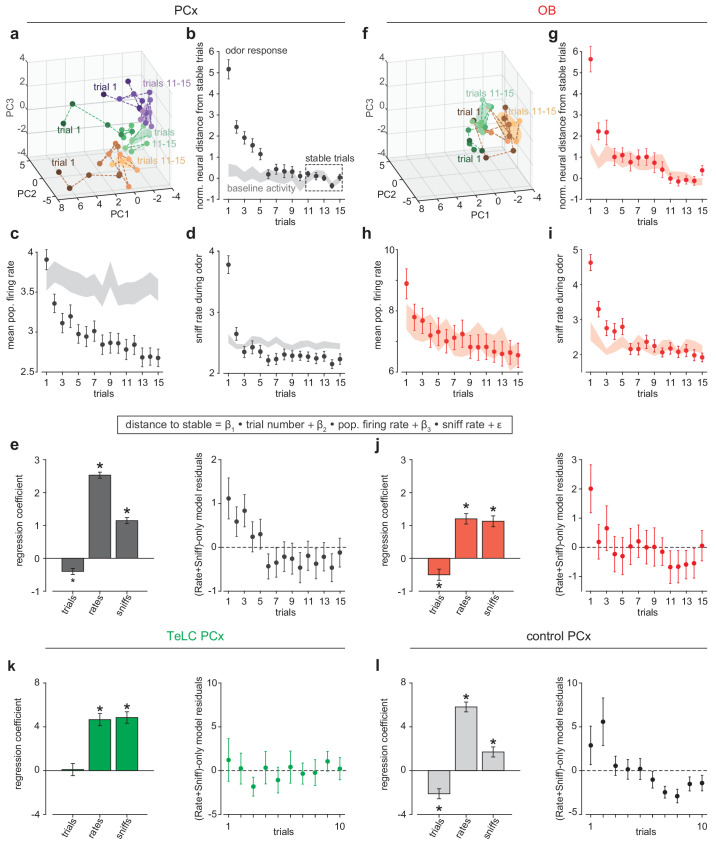
Figure 6. Rapid pattern formation in PCx population responses.
(a, f) PCA trajectories for the first 15 presentations of three odors in an example simultaneous PCx (a) and OB (f) recording. The third odor in OB data occupied overlapping PC space and was omitted for visual clarity. The area occupied during the designated ‘stable’ trials is shown as mean ± 1 s.d. ellipsoids. Different colors correspond to different odors. (b, g) Average Euclidean distance from trial population vectors to stable trials normalized by the average distance between stable trials (b, PCx: n = 132 experiment-odor pairs, g, OB: n = 45 experiment-odor pairs, mean ± SEM). The shaded area shows distances computed using pre-odor baseline activity (mean ± SEM). (c, h) Average population firing rates during odor response (mean ± SEM) or pre-odor baseline (shaded area, mean ± SEM) for PCx (c) or OB (h). (d, i) Average sniffing rates during odor response (mean ± SEM) or pre-odor baseline (shaded area, mean ± SEM) for PCx recordings (d) and OB recordings (i). (e) Left, multiple linear regression coefficients for effects of sniff rate, population firing rate, and trial number on population distance to stable in PCx (mean ± SEM). All main and interaction coefficients are significant (p<0.05). Right, Residuals plot of multiple linear regression on distance-to-stable fit with only sniff rate and population firing rate predictors, showing decreasing distance with trial number independent of these predictors. (j) As in e, but for OB recordings. (k, l) As in e, but for TeLC-infected PCx (k, n = 36 experiment-odor pairs) and contralateral control PCx (l, n = 24 experiment-odor pairs). Distance changes are fully explained by sniff rate and overall population firing rate in TeLC-PCx, but depend on trial number in control PCx.


