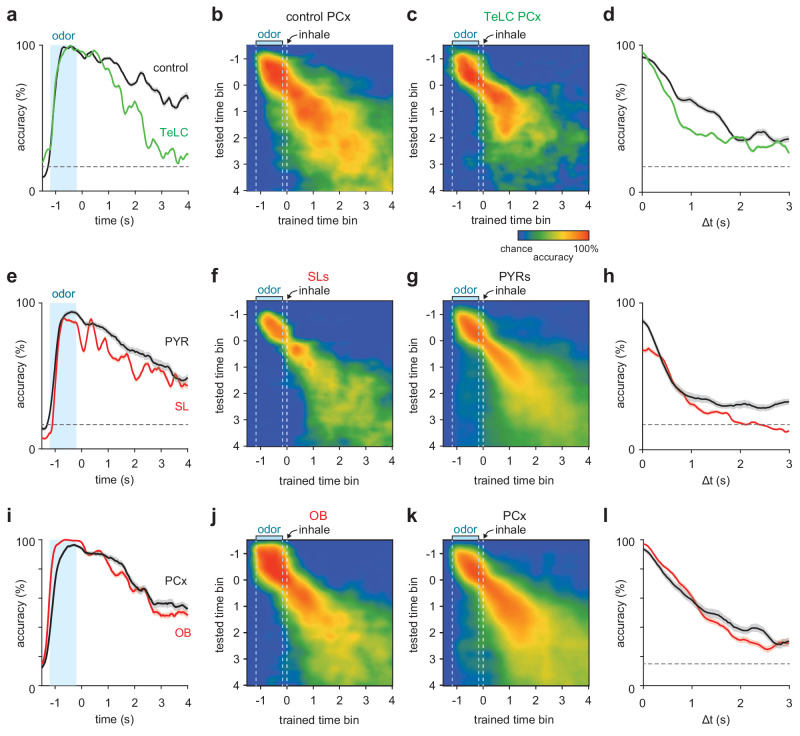
Figure 7. Short-term pattern stability in recurrently-connected PCx cells.
(a–c) Average cross-time decoding accuracy for pseudopopulations of 200 cells recorded from control (b) or TeLC-infected (c) PCx. Responses were aligned to the first sniff after odor offset. (a) Decoding accuracy for training and testing on identical time bin at increasing times from odor offset for control (black) and TeLC- (green) PCx. Mean ± 95% bootstrapped confidence intervals. (d) Mean decoding accuracy at increasing temporal distance between the training bin (t = 0) and test bin in control (black) and TeLC- (green) PCx. These data are reflected in the rightmost dashed vertical lines in a and b. Mean ± 95% bootstrapped confidence intervals. (e–h) As in a-d, but for pseudopopulations of 100 SLs (f, red) or PYRs (g, black). (i–l) As in a-d, but for pseudopopulations of 170 OB cells (j, red) or PCx cells (k, black).

