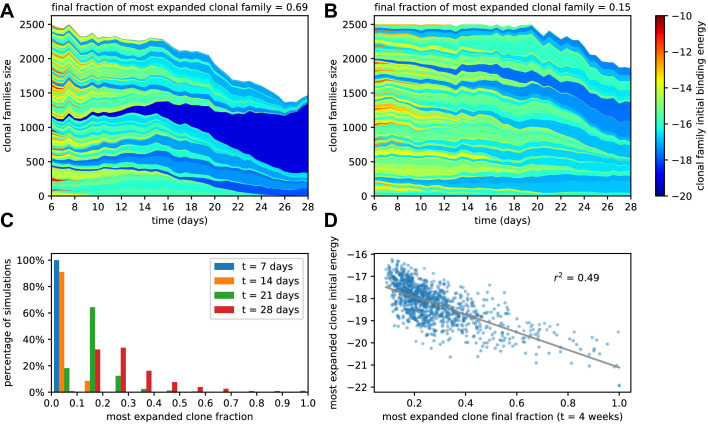
Figure 3. Simulated GCs present different levels of homogenization.
(A) Example of homogenizing selection in GC evolution. Population size as a function of time for each clonal family in stochastic simulations of a single GC. The GC were initiated with an injected antigen dosage of . The color of the clonal family reflects the initial binding energy of the founder clone according to the color-scale on the right. On top, we report the fraction of the final population composed by the most expanded clonal family. In this example, the progeny of a single high-affinity founder clone (dark blue) progressively takes over the GC, and at week 4 constitutes around 70% of the GC B-cell population. (B) Example of heterogeneous GC evolution. Contrary to the previous example, many clonal families coexist, without one dominant clone taking over the GC. (C) Evolution of the distribution of the most-expanded clone fraction. We perform 1000 stochastic simulations and evaluate the fraction of the population constituted by the most-expanded clone at each time (cf colors in the legend). Distributions show the percentage of simulations falling in 10 bins splitting equally the [0,1] interval according to the values of their dominant clone fractions. Notice the presence of heterogeneous and homogeneous GCs at week 4. (D) Scatter plot of final (week 4) population fraction versus initial binding energy for the most-expanded clone; the straight line shows the best linear fit (). The presence of a clone with high initial affinity favors the advent of a homogeneous GC.

