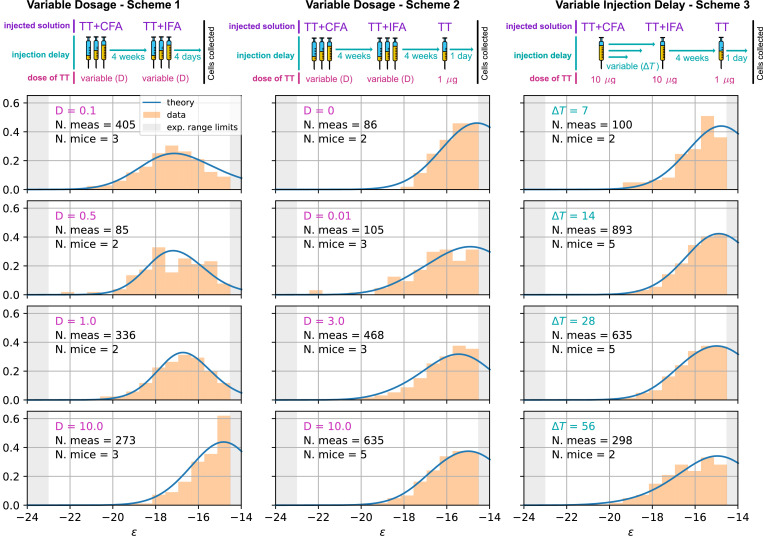
Figure 5. Comparison between model-predicted and experimentally measured affinity distributions of antibody-secreting cells (Ab-SCs) for different immunization protocols.
A schematic representation of the protocol used is reported on top of each column. Scheme 1 (left column) consists of two injections at the same Ag dosage , separated by a 4 weeks delay. Cells are harvested 4 days after the second injection. Scheme 2 (middle column) is the same as scheme one until the second injection. Then, after an additional 4 weeks delay, a supplementary boost injection of 1µg pure TT is administered, and cells are harvested one day later. Scheme 3 (right column) is the same as Scheme two but the TT-dosage of the first two injections is kept constant, and instead the delay between them is varied. Experimental data (orange histograms) consists in measurements of affinities of IgG-secreting cells extracted from mice spleen. The experimental sensitivity range (, or equivalently ) is delimited by the gray shaded area. Blue curves represent the expected binding energy distribution of the Ab-SCs population according to our theory under the same model conditions. For a good comparison, all the distributions are normalized so that the area under the curve is unitary for the part below the experimental sensitivity threshold. For every histogram, we indicate the number of single cell experimental measurements that make up the experimental distribution (black), the number of different mice from which the measurements were pooled (black), and the value of the varied immunization scheme parameter, corresponding to dosage (pink) in μg of TT for the first two schemes and time delay (blue) in days for the third.

