. 2020 Jun 2;9:e56159. doi: 10.7554/eLife.56159

Figure 5. Linkers as modulators of self-assembly propensity.

(A) The size of the largest cluster for flexible linker regions(κ=2 kcal/mol) with varying inter-linker interaction strength (black curve, 0.1 kcal/mol and purple curve, 0.5 kcal/mol). Sticky inter-linker interactions result in smaller cluster sizes. (B). Purple Curve – Mean Radius of gyration for the individual-polymer chains (<Rgchain>) within a self-assembled cluster as a function of increased inter-linker interactions. Black Curve— Mean density of the clusters as a function of inter-linker interaction strength. (C) The mean re-organization times, Texhaust-valency as a function of linker-stiffness, for different values of inter-linker interaction strengths.

Figure 5—source data 1. Compressed zip file containing the source data for largest cluster size, density of the cluster and radius of gyration of constituent chains, for different values of ϵns plotted in Figure 5.

Figure 5.

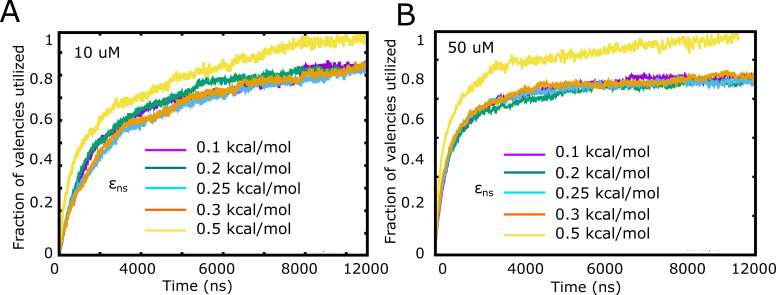
Figure 5—figure supplement 1. Fraction of valencies utilized as a function of increasing inter-linker interaction strength, for (A) 10 μM and (B) 50 μM free monomer concentration.

Figure 5—figure supplement 1.

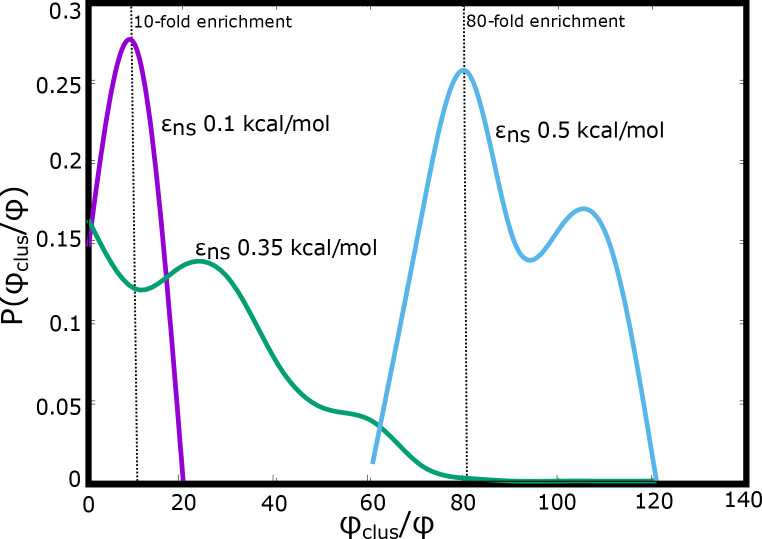
Figure 5—figure supplement 2. The probability of finding clusters with varying densities (normalized by the bulk densities) for different values of inter-linker interactions.

Figure 5—figure supplement 2.

As the inter-linker interactions increase, the degree of enrichment can go from 10-fold to 100-fold.
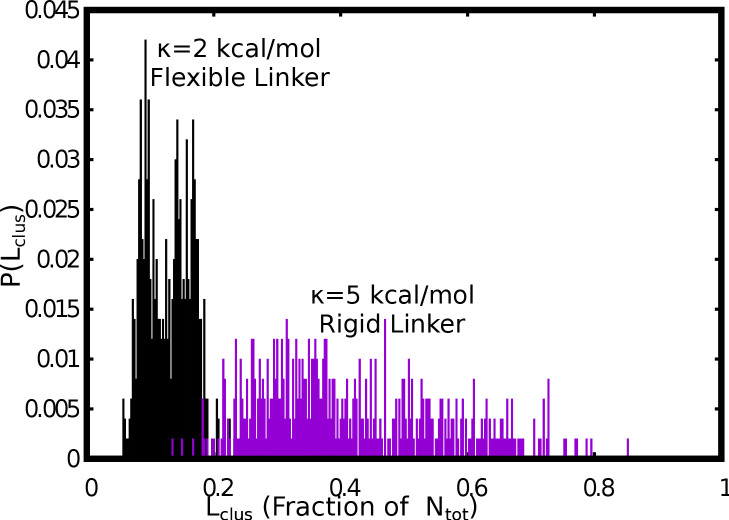
Figure 5—figure supplement 3. Comparision between the size distributions of the largest cluster, for flexible (κ=2 kcal/mol) versus stiff (κ=5 kcal/mol) linker regions.

Figure 5—figure supplement 3.

The free monomer concentration used for this plot was 50 μM and a weak interlinker interaction strength of ϵns = 0.1 kcal/mol was used.