. 2020 Jun 2;9:e56159. doi: 10.7554/eLife.56159

Figure 7. Kinetic Monte Carlo Simulations.

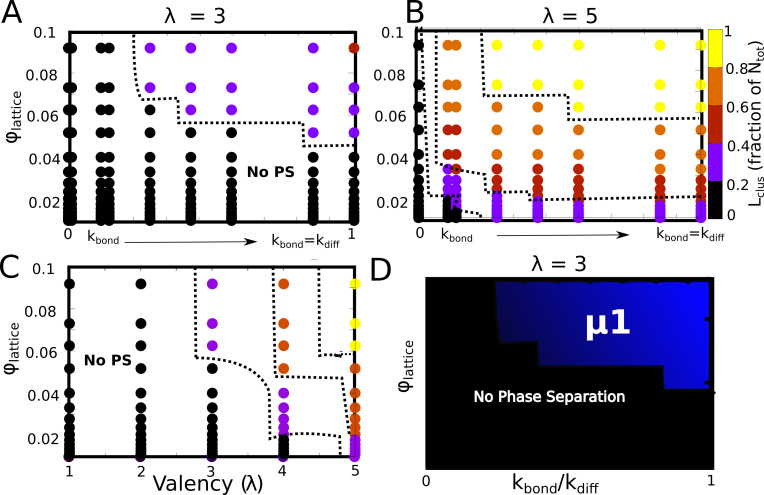
(A) Phase diagram highlighting the different phases (metastable microphase (μ1) or system-spanning macrophase (μ2), and the non-phase separated state (No PS) ) encountered upon increasing kbond(between 0 and kdiff ), and the bulk density of monomers (ϕlattice ) within the box. The assembling particles have a valency (λ) of 5 in these simulations. The region shaded yellow represents part of the phase-space where we observe a system-spanning network whereas the bluish-red region represents the metastable micro-phase with a distribution of cluster sizes (see Figure 7—figure supplement 3 for distributions). As we move from the blue to the red regions in this dynamic phase diagram, the size of the single largest cluster increases (also see Figure 7—figure supplement 1). (B) Phase diagram highlighting the different phases encountered upon varying valency and bulk density as the phase parameters. The system-spanning macrophase is only encountered for larger valency particles at higher densities. This phase diagram was computed for kbond=kdiff and ϵns of 0.35 kT. (C) The fraction of monomers in the largest cluster as a function of epsilon, for kdiff = kbond and ϕlattice = 0.04. The single largest cluster sizes in all sub-panels of this Figure were computed for a simulation time-scale of 2 hr (with the fundamental timsecale of diffusion being set to kdiff = 1 s-1 ).

Figure 7—source data 1. Compressed zip file containing the source data for kinetic phase diagrams in Figure 7.

Figure 7.

Figure 7—figure supplement 1. Detailed phase diagrams for (A) and (B) ϕ-kbond, (C) ϕ-λ as the phase parameters.

Figure 7—figure supplement 1.

The cluster sizes were computed at the end of a simulation run of 2 hr (actual time), setting the rate of diffusion kdiff to 1 s-1. (D) The bonding rate kbond was varied to identify the relationship between kbond and kdiff.
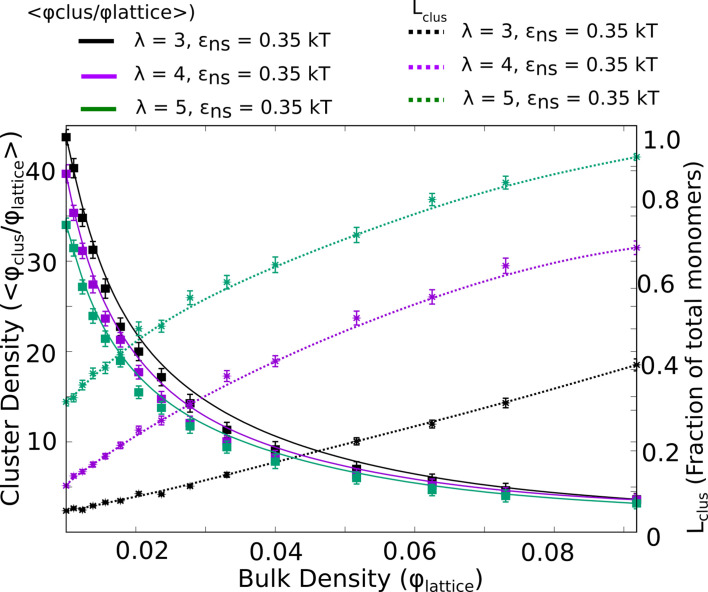
Figure 7—figure supplement 2. Intra-cluster densities of largest cluster (solid curves) and the corresponding sizes of the single largest cluster (dashed curves) as a function of bulk density, for three different values of λ.

Figure 7—figure supplement 2.

In the regime where cluster sizes approach the total number of monomers, the density of the cluster is at its lowest.
Figure 7—figure supplement 3. Cluster size distributions for varying densities for λ=3 (A), and λ=5 (B).

Figure 7—figure supplement 3.

(C) Effect of valency on size distributions at a fixed ϕlattice of 0.09. These distributions were computed at the end of 100-independent simulation runs of 2 hr (actual time) each. μ1 and μ2, in these figures refer to the macro-phase separated state (with large network-spanning clusters), and the micro-phase separated state (with coexisting clusters of various sizes), respectively. These distributions are representative of the μ1 and μ2 phases shown in the Figure 7 of the main text.
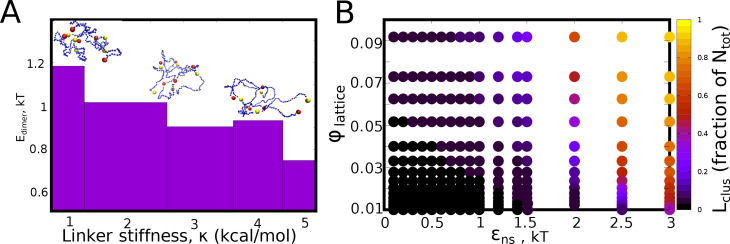
Figure 7—figure supplement 4. Inter-protein interaction strengths.

Figure 7—figure supplement 4.

(A) The mean pair-wise interaction energy for 100 different dimeric structures (from the LD simulations), for an inter-linker interaction strength of 0.1 kcal/mol, for different values of linker bending rigidity. (B) The ϵns-ϕ phase diagram (for λ=0) showing no phase separation for low values of isotropic interaction strength. However, for values of ϵns> 1kT, phase separation is observed at the end of the simulation timescale of 2 hr (actual time).
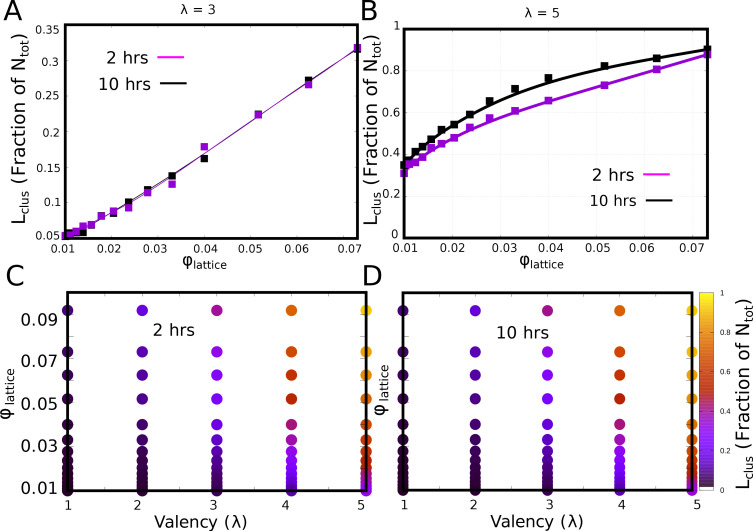
Figure 7—figure supplement 5. Convergence of phase diagrams.

Figure 7—figure supplement 5.

(A and B) The fraction of monomers in the largest cluster for 2 and 10 hr of actual time, for λ of 3 and 5, respecively. (C and D). The λ-ϕ phase diagram at the end of 2 and 10 hr of simulation time, respectively, showing very little difference.
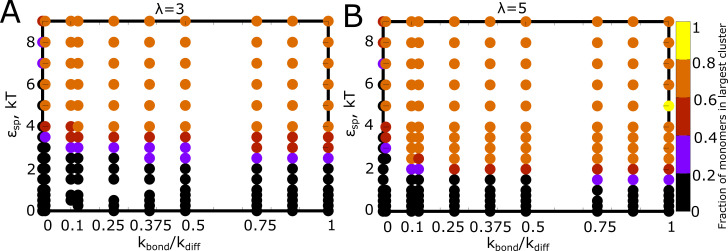
Figure 7—figure supplement 6. Detailed phase diagrams for (A) and (B) ϵsp-kbond as the phase parameters.

Figure 7—figure supplement 6.

The ϕlattice was set to 0.04, an intermediate density identified from the previous phase diagrams with density as a phase parameter. The cluster sizes were computed at the end of a simulation run of 2 hr (actual time), setting the rate of diffusion kdiff to 1 s-1.