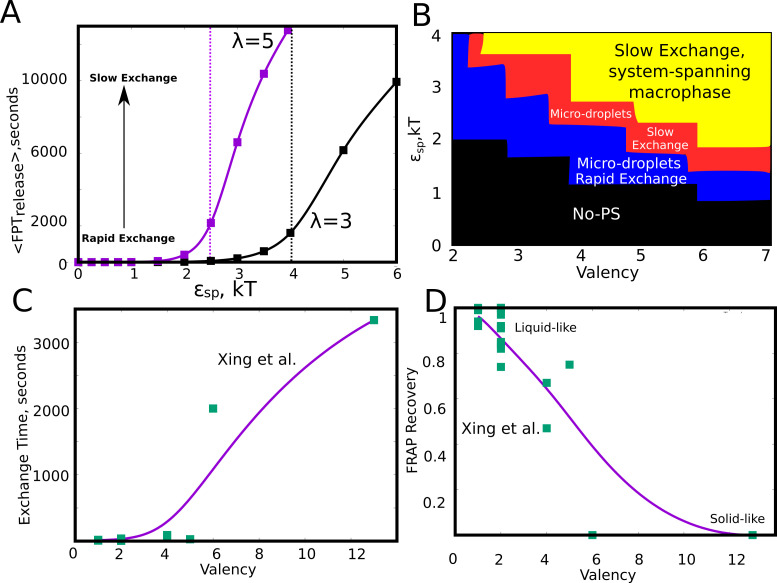
Figure 8. Effect of model parameters on the exchange times between monomers and the aggregates.
The parameter values used in panels A and B are =0.04, / = 1. (A) Mean first passage time for the monomers to go from the buried state (with four neighbors) to the free state (with no neighbors) in response to varying values of specific interaction strength. The two curves show the trends for species with different interaction valencies. The dashed solid lines refer to value of beyond which the largest cluster consumes 50% or more of available monomers. (B) The state of the system, for variation in and suggests that the system displays remarkable malleability in dynamicity and size distributions. Weak and a low results in no phase separation (shaded black). For higher values of both these parameters, the system can access the single large macro-phasic state (shaded yellow), however with a dramatic slowdown in exchange times. For an intermediate range, the system adopts a metastable microphase separated state, with either slow (shaded red) or fast-exchange (shaded blue) dynamics. (C) The experimentally determined molecular exchange times for molecules of varying interaction valencies. (Xing et al., 2018). (D) The extent of recovery after a photobeaching experiment, for interacting species with varying valencies. The data in panel C) and D) has been obtained from a study by Xing et al., 2018. The solid curves in C and D are added to guide the eye.


