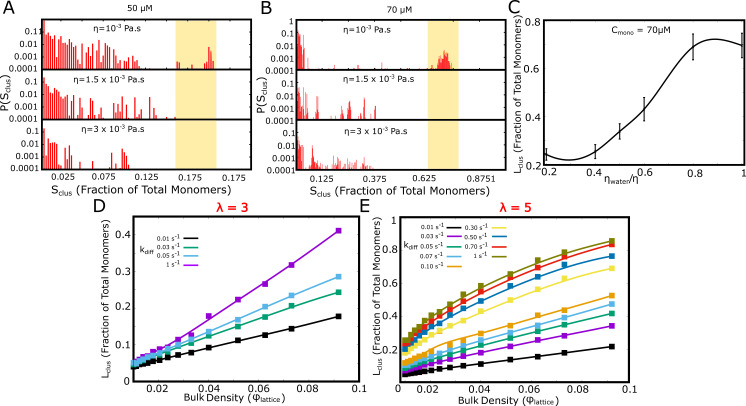
Figure 9. Effect of solvent viscosity.
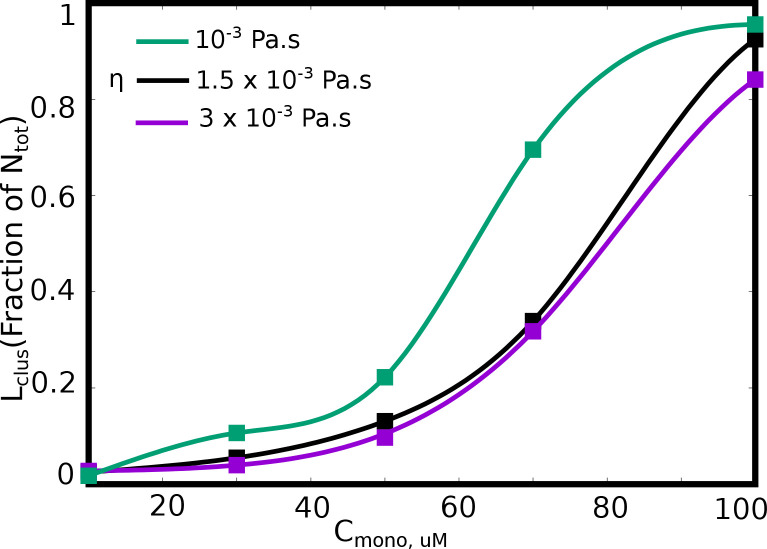
Langevin Dynamics Simulations. (A and B) Cluster size distributions from Langevin dynamics simulations for different values of solvent viscosity and different free monomer concentrations. The shaded region in the two subpanels (A) and (B) is to highlight that a more viscous solvent results in larger clusters disappearing from the distribution. (C) The size of the single largest cluster as a function of solvent viscosity for a free monomer concentration of 70 μM. (D and E) Monte Carlo Simulations. The size of the single largest cluster as a function of density for varying rates of diffusion, for specific interaction valencies =3 (D) and = 5 (E).


