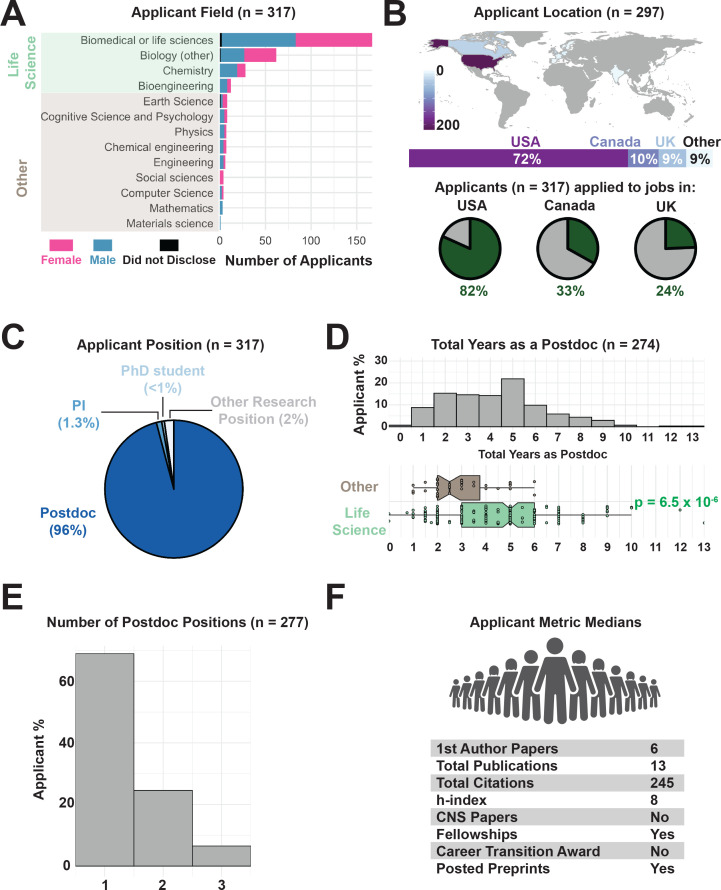
Figure 2. Demographics of academic job applicants.
(A) Distribution of survey respondents by self-identified gender and scientific field (Supplementary file 2). Fields highlighted in green were grouped together as life-science related fields for subsequent analyses. (B) Distribution of countries where respondents were researching at the time of the survey (top, see Supplementary file 3) and the countries in which they applied to faculty jobs (green slices of pie charts, bottom; see Supplementary file 4). (C) Self-reported positions of applicants when applying for faculty jobs (Supplementary file 5). (D) The number of years spent as a postdoctoral researcher ranges from 1 year or fewer (4% of applicants) to eight or more years (9% of applicants; maximum of 13 years, top). Life-science related postdoctoral training (n = 268 respondents) takes significantly longer than in other fields (n = 49 respondents; p=6.5×10⁻⁶, bottom; for data see Supplementary file 6; for statistical analysis see Supplementary file 7). (E) Number of postdoctoral positions held by survey applicants (Supplementary file 8). (F) Median values for metrics of research productivity in the applicant pool (Supplementary file 9).

